Gold price action this Thursday NY session is flashing a clear warning — the $4,100 support floor is under siege. After five weeks of consolidation around key levels — a pattern highlighted by FOREX.com’s latest market note — XAU/USD has slipped below the short-term moving averages and is now trading at $4,111.61, dangerously close to the psychological $4,100 barrier. Last week’s June US CPI data confirmed persistent inflation, keeping Fed rate hike expectations alive and weighing on non-yielding gold. With the American session in full swing, sellers are pressing lower, threatening to trigger a fresh wave of liquidations. The question now is whether bulls can defend the $4,100 line or if a breakdown toward $4,080 is inevitable this afternoon.
Gold Price Market Overview
Macro Context
The US Dollar Index (DXY) has firmed above 104.50 this week, supported by a hawkish-leaning Federal Reserve. Treasury yields on the 10-year note are clinging near 4.55%, reflecting the market’s recalibration after last week’s CPI and PPI releases showed sticky core inflation. The Fed’s “higher-for-longer” messaging continues to sap gold’s appeal as a zero-yield asset.
Meanwhile, geopolitical tensions — particularly in the Middle East — have offered intermittent safe-haven bids but have failed to generate sustained upside. Over the past five weeks, the gold price has been locked in a tight range, consolidating around the $4,100–$4,180 band, as tracked by a recent Forex.com analysis. This extended coiling typically precedes a significant breakout, and with price now testing the lower boundary, the risk of a downside resolution has increased.
Session Outlook
The American session is set to dictate near-term direction. With no high-impact US data releases scheduled for today, the focus shifts to technical levels and liquidity-driven moves. The current price just above $4,100 has traders watching for a clean break below the round number, which would likely accelerate selling momentum toward the $4,080 area. Conversely, if buyers step in to defend the $4,100 support, a sharp short-covering rally could target resistance at $4,147.61 (the S2 pivot). However, the overriding sentiment remains bearish as the moving average structure points to further downside pressure.
Gold Price Technical Analysis
Moving Average Structure
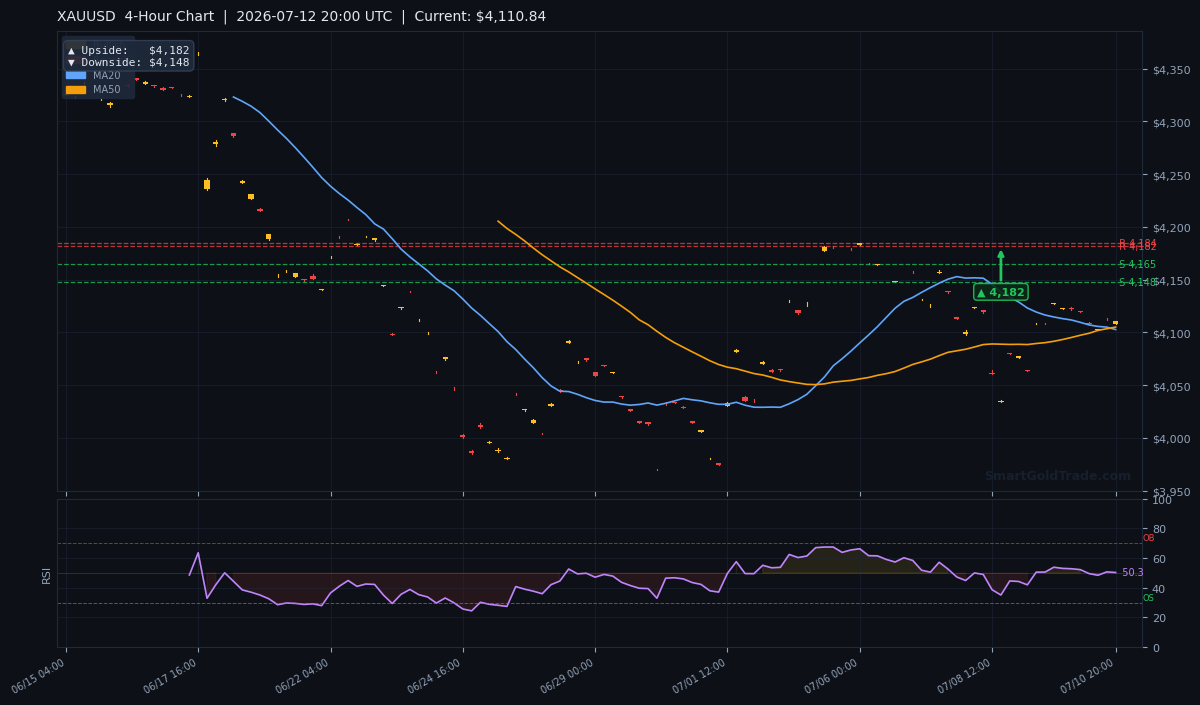
The 4-hour chart paints a diverging picture. The 20-period moving average sits at $4,102.71, and the 50-period MA is at $4,105.05. With spot gold at $4,111.61, price is marginally above both, offering a short-lived bullish bias.
However, the crucial detail is the EMA orientation: the MA20 is below the MA50, a condition the system flags as short-term bearish pressure. This negative crossover suggests that any upside attempt to lift the gold price will likely be capped.
The longer-term 200-period MA looms far above at $4,229.96, confirming that gold remains in bear territory on the daily timeframe. The gap between current price and the MA200 underscores the medium-term downtrend.
RSI and Momentum
The 14-period RSI reads 50.3, squarely in neutral territory. While not oversold, the RSI’s failure to push above 60 on recent bounces indicates underlying weakness.
With the average true range (ATR(14)) at $14.29, the expected daily volatility suggests a potential trading range of approximately $4,097–$4,125 over the next 24 hours. Such narrow swings reinforce the coiled state of the gold price; a breakout, when it comes, is likely to be sharp and directional.
Key Price Levels
From the pivot indicator, support and resistance levels are calculated as follows:
| Level | Price |
|---|---|
| S1 (Support turned Resistance) | $4,164.51 |
| S2 | $4,147.61 |
| R1 | $4,184.32 |
| R2 | $4,181.55 |
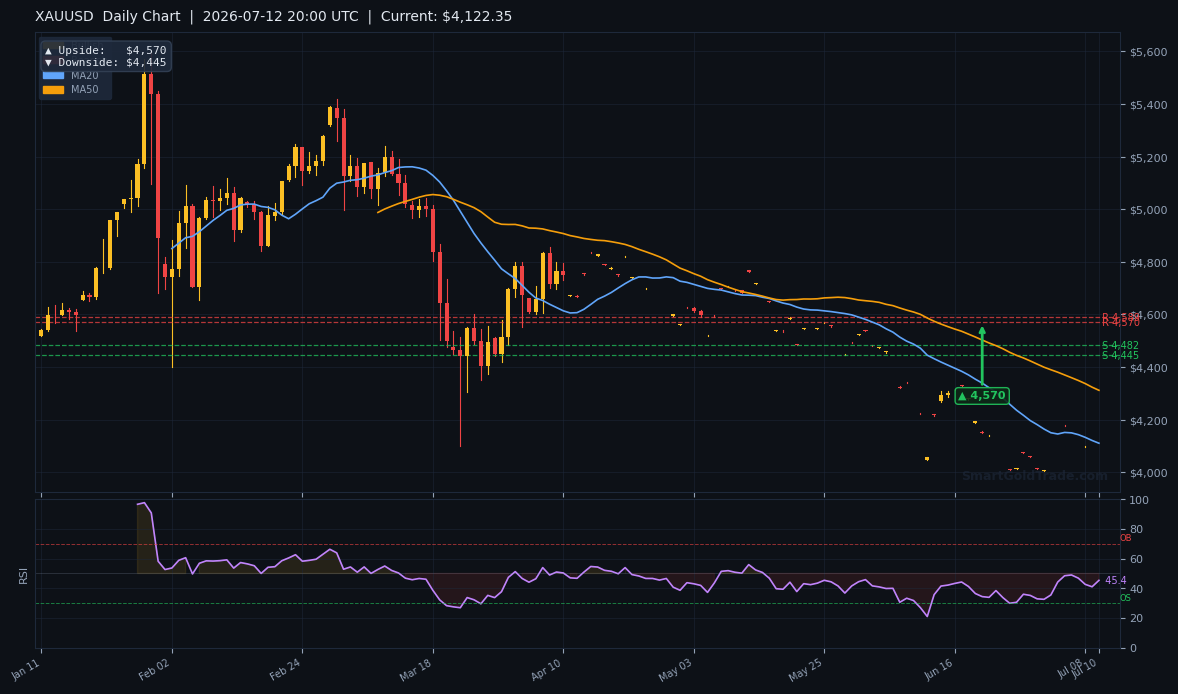
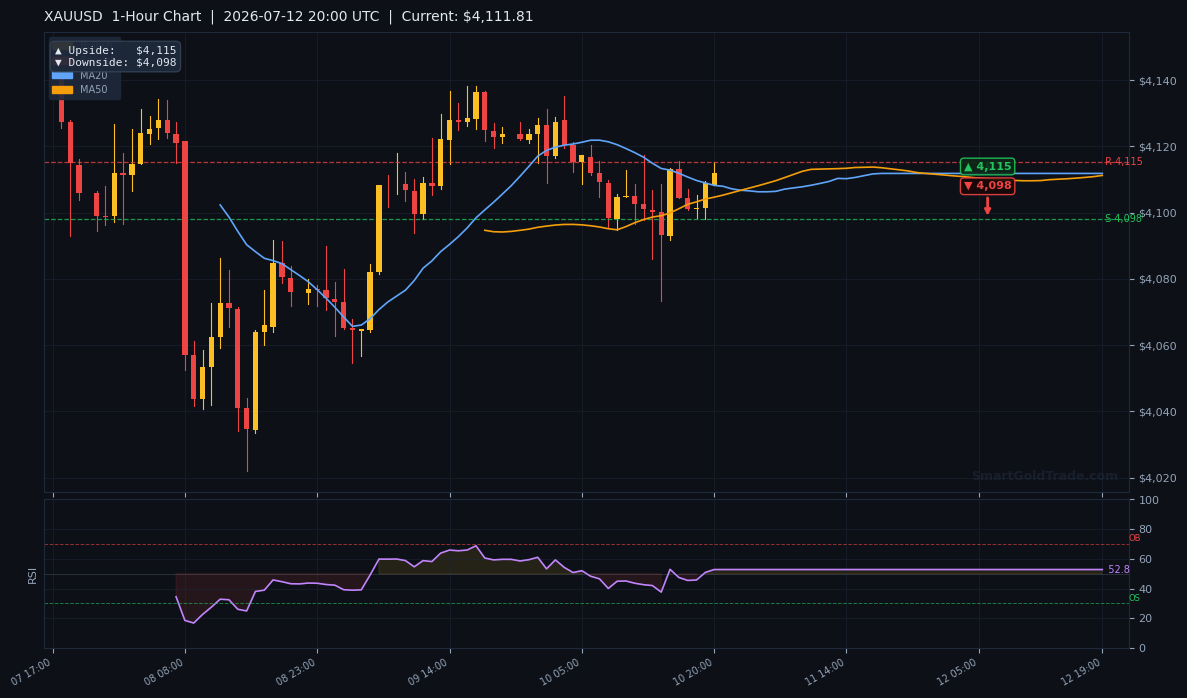
Immediately, the gold price is trading well below all these levels, turning them into overhead resistance. On the 4-hour timeframe, the pivot targets are $4,182 on the upside and $4,148 on the downside, while daily targets stretch to $4,570 (upside) and $4,445 (downside). The 1-hour chart shows a more immediate downside objective at $4,098 and upside target at $4,115.
Fundamental Drivers
The primary headwind for gold remains Federal Reserve policy. Last week’s Consumer Price Index (CPI) for June printed at 3.1% year-on-year, slightly below the prior reading but still above the Fed’s 2% target. Core CPI held steady at 4.0%, reinforcing the view that the Fed will hold rates at 5.25%-5.50% through the summer.
The resulting buoyant US Dollar and elevated Treasury yields continue to drain gold’s safe-haven appeal. Additionally, the market has priced in only a modest probability of a rate cut before November, reducing the bullish catalyst that gold longs need.
The geopolitical backdrop — including simmering Iran tensions — has occasionally provoked short-lived spikes, but the macro interest-rate environment overpowers these moves. This dynamic keeps the gold price under sustained downside pressure during the American session.
Key Event to Watch
This week, traders should keep a close eye on Wednesday’s US Retail Sales report for June. A stronger-than-expected figure would likely push the Dollar higher and deepen gold’s decline toward $4,080, extending the gold price’s recent fall. Conversely, a miss could give bulls breathing room to stage a recovery up to the $4,147.61 resistance. The interplay between consumer spending data and Fed rate expectations will be the defining factor for gold’s next leg.
Devil's Advocate
The bearish case is compelling, but traders must acknowledge the risk of a sharp reversal. If buyers successfully defend the $4,100 support and push price back above the $4,147.61 S2 level on a closing basis, the short-term outlook would flip bullish. Such a move would invalidate the current breakdown signal and open the door to a rally toward $4,184.32 (R1).
The combination of a bullish RSI divergence and a recovery above the MA50 at $4,105.05 could reignite upside momentum. A close above $4,147.61 would be the line in the sand for bears.
Trading Strategy for American Session
For the remainder of the NY session, two strategies stand out for active traders.
Approach 1 — intraday short: Enter on a breakdown below the $4,098 1-hour downside target. Place a stop loss at $4,107 (just above the MA20) and set a take-profit at $4,080, representing a 1:1.5 risk-reward. The ATR of $14.29 confirms the 18-point target fits comfortably within the daily scope.
Approach 2 — conservative sell limit: If price bounces toward the $4,115 resistance, short with a stop at $4,125 (above the high of the 1-hour candle) and target $4,100 initially. This offers a tighter risk and capitalizes on any failed bounce near resistance.
Before executing these setups, ensure your trading environment aligns with Islamic principles. SmartGoldTrade’s halal gold trading platform lets you trade spot gold with full physical backing, free from riba and overnight swaps. For those who prefer trading with professional guidance, professional gold trading signals can help identify entry and exit points in real time, complementing your own analysis.
Key Takeaways
- XAU/USD is clinging to the $4,100 support with sellers in control during the NY session.
- MA20 ($4,102.71) lying below the MA50 ($4,105.05) signals short-term bearish pressure.
- RSI at 50.3 offers no clear directional bias, keeping the door open for a breakdown.
- Overhead resistance at $4,147.61 and $4,164.51 is likely to cap any intraday bounce.
- A daily close below $4,100 would expose the $4,080 zone; the daily pivot chart points to a longer-term downside at $4,445.
- Wednesday’s US Retail Sales release is the next major fundamental catalyst — a strong print could accelerate the decline.
Conclusion
The American session has turned decisively bearish, with gold price repeatedly testing the $4,100 support floor. The combination of an adverse moving-average structure, neutral RSI, and heavy overhead resistance at $4,147.61 suggests that the path of least resistance is downward. A failure to hold $4,100 would likely trigger a swift sell-off toward $4,080 and extend the five-week consolidation breakdown that traders have been bracing for. On the flip side, a robust defense of this level could see a short-cover rally back to the mid-$4,100s. For now, the weight of the evidence tips the scales in favor of the bears. The gold price remains critically poised at this junction, demanding tight risk management this session.
For those seeking longer-term hedging, purchase physical gold as a portfolio anchor during volatile periods.
Frequently Asked Questions
Why is gold under pressure today?
The gold price is under pressure due to a strengthening US Dollar and elevated Treasury yields following sticky June CPI data. The Federal Reserve’s hawkish stance reduces the appeal of non-yielding bullion.
What is the next support level if $4,100 breaks?
A break below $4,100 would target the 1-hour pivot at $4,098, then the psychological $4,080 zone. Extended selling could push the gold price toward the daily pivot downside of $4,445 in the coming weeks.
Can gold price recover above $4,147.61 today?
A recovery above $4,147.61 is possible but unlikely given the bearish EMA structure. A close above this level would shift short-term bias bullish and open the door to $4,184.32.
Risk Disclaimer: Trading Gold (XAU/USD) carries significant risk of loss and is not suitable for all investors. This content is for informational purposes only and does not constitute financial advice. Always conduct your own research and trade responsibly.