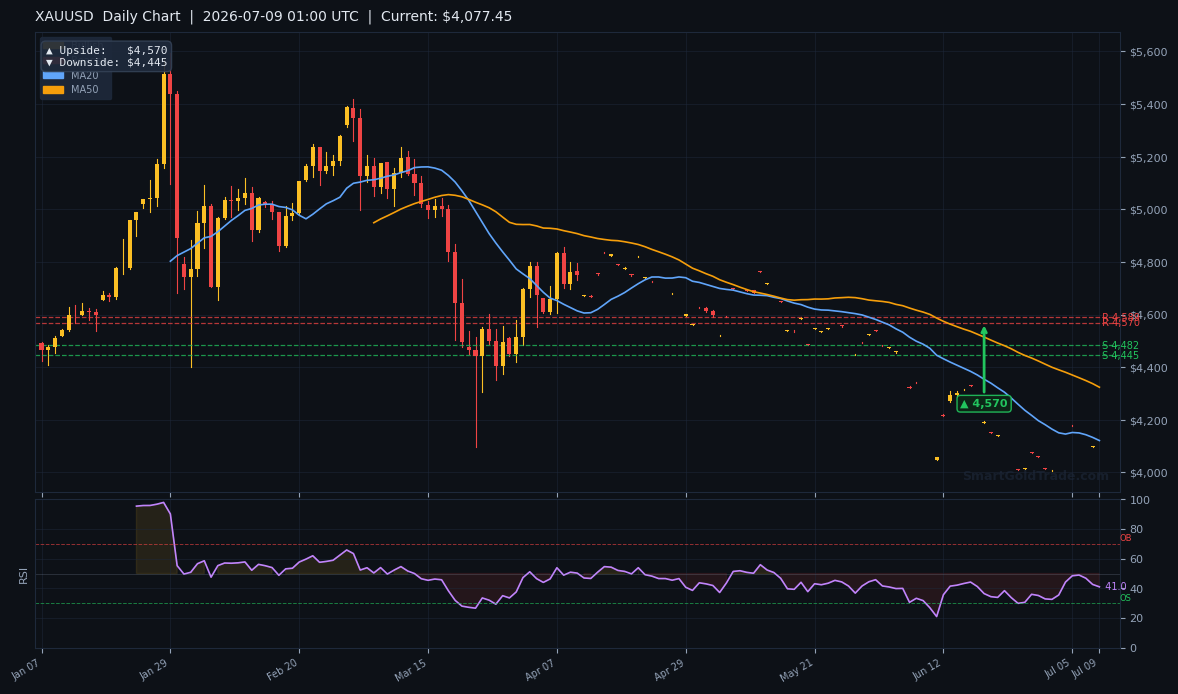
Gold price kicks off the Asian session at $4,080.65 per troy ounce, still reeling after tumbling through the $4,148 support level yesterday. The precious metal now sits beneath every major moving average, leaving bulls searching for a sturdy floor. Later today, the Federal Reserve releases minutes from its June policy meeting — a potential catalyst that could either harden the bearish bias or trigger a sharp short‑squeeze.
Despite a softer US dollar overnight — partly driven by a surging Japanese yen on verbal intervention fears — gold failed to attract safe‑haven bids in thin late‑day trade. The metal’s inability to rally on dollar weakness underscores the technical damage. Traders are now laser‑focused on whether the gold price can reclaim the $4,148 pivot zone or suffer another leg lower.
Gold Price Technical Landscape: Key Levels to Watch
The daily chart paints a sobering picture for gold price bulls. After slicing through $4,148 — a level that had acted as both support and resistance over recent weeks — XAU/USD now hovers well below the 50‑day, 100‑day and 200‑day moving averages. This alignment signals a clear downtrend in the short‑to‑medium term.
Immediate support rests near the July 7 low of $4,060. A break below that would expose the psychologically important $4,000 handle, which aligns with the April swing low. On the upside, the breached $4,148 level now serves as formidable resistance, reinforced by the 50‑day moving average currently drifting around $4,170.
For any meaningful bullish reversal, gold price must not only crack $4,148 but also hold above it on a daily closing basis. Secondary resistance sits at $4,200, where a cluster of prior highs and the 100‑day moving average converge. Momentum indicators like the RSI (14) are hovering near 37, not yet deeply oversold, suggesting there is room for further downside if selling pressure resumes.
- Support: $4,060 (intraday), $4,000 (psychological)
- Resistance: $4,148 (pivot), $4,170 (50‑day MA), $4,200 (key zone)
For those seeking real‑time guidance, professional gold trading signals can help filter out the noise around these critical inflection points. Such alerts often spotlight precise entry and exit levels, backed by institutional analysis, which is especially valuable when gold price is at a make‑or‑break juncture.
Fundamental Drivers: Why the Fed Minutes Could Move Gold Price
The Federal Reserve’s June meeting minutes, due later today, are the market’s main event risk. At that meeting, the Fed held rates steady but pencilled in two more rate hikes before year‑end. If the minutes reveal a lively debate about pausing or a more hawkish tilt, gold price could face renewed headwinds as rate‑hike expectations strengthen the dollar and lift real yields.
Conversely, any dovish hints — such as concerns about a slowing economy, tightening credit conditions, or inflation easing faster than expected — could spark a gold price rally. In that scenario, the short‑squeeze potential is substantial because speculative net‑long positions in gold futures have been trimmed sharply over the past month. A surprise dovish tone would force those bets to unwind rapidly, catapulting gold price back toward the $4,200 region.
The currency market adds another layer. The yen’s surge this week has dampened the dollar index, but gold has not benefited proportionally, suggesting that real yields are still the dominant driver. If the minutes indicate that most members see the terminal rate approaching 5.5% or higher, real yields could climb further, keeping gold price under pressure even if the dollar dips.
Gold Price Outlook: Reclaiming $4,148 or Further Declines?
The battle for sentiment hinges on the $4,148 pivot. A daily close above this threshold would invalidate the breakdown and could set off a short‑squeeze squeezing gold price toward $4,200 and beyond. However, given the technical damage and the weight of hawkish expectations, the path of least resistance remains lower in the absence of a marked Fed surprise.
If sellers manage to push gold price through $4,060, the $4,000 mark becomes the next logical target — a level not seen in months. Such a decline would also coincide with a “death cross” of the 50‑day below the 200‑day moving average, a bearish indicator that could accelerate algorithmic selling. Yet seasonal factors, like strong Asian physical demand during wedding seasons, could cushion declines near round‑number supports.
In this low‑liquidity Asian window, patient traders will watch whether gold price can consolidate and build a base. A successful defence of $4,060 would at least shift the short‑term risk profile to a range‑bound scenario between $4,060 and $4,148, letting the market digest the Fed minutes before committing.
Shariah‑Compliant Gold Trading in a Volatile Market
For Muslim investors, the current gold price dynamics open opportunities that align with Islamic finance principles. SmartGoldTrade offers a halal gold trading platform where every trade is backed by physical bullion, with no interest (riba) and no leverage. This means you can trade the gold price with fractional lots — as little as one‑tenth of a troy ounce — without resorting to synthetic instruments or swaps.
While conventional brokers often use CFDs and overnight financing, SmartGoldTrade’s spot model ensures you own actual allocated gold. In turbulent times like these, the peace of mind that comes from real asset backing cannot be overstated. Should the gold price dip further, a halal trading account lets you buy the dips directly, without worrying about haram elements.
For those who prefer a longer‑term approach, physical gold products such as 24K bars and 22K coins offer a tangible hedge. Owning physical gold removes counterparty risk entirely and is a time‑tested store of value when monetary policy outlooks shift. Whether you’re an active day trader watching the $4,148 level or a buy‑and‑hold investor accumulating coins, the current gold price environment provides strategic entry points.
Alternatives Beyond Active Trading
If you’d rather not monitor charts hourly, SmartGoldTrade also hosts Islamic partnership investment pools and copy trading solutions. But for immediate exposure to the gold price moves around the Fed minutes, the spot halal trading desk remains the most direct route. With the stakes high at $4,148, having a Shariah‑compliant vehicle lets you participate in the market without compromising your faith.
FAQ
Q: Why did gold price fall below $4,148 even though the US dollar weakened?
Gold price’s drop despite a softer dollar highlights the dominance of real yields and technical selling. The yen’s surge was largely a currency‑specific move, while gold’s safe‑haven appeal was dampened by expectations of further rate hikes. Additionally, the breach of $4,148 triggered stop‑loss orders and algorithmic selling, accelerating the decline.
Q: How can I trade the gold price halal without leverage or swaps?
You can trade the gold price in a Shariah‑compliant manner through SmartGoldTrade’s spot platform or our copy trading service. All positions represent physical gold ownership with no overnight interest, making it permissible under Islamic law.
Q: What levels should I watch for a gold price reversal after the Fed minutes?
A daily close above $4,148 would be the first bullish signal, opening the door to $4,200. On the downside, a break below $4,060 could target $4,000. Real‑time alerts from professional gold trading signals can help you act on these thresholds promptly.