
Gold Price Holds $4,535 — Bulls Target $4,713 Resistance
The gold price is trading at $4,535.70 during the Asian session, consolidating after last week’s sell-off. The market is quietly positioning for this week’s FOMC minutes — a high-impact event that could either confirm the bearish trend or flip momentum if the tone is dovish.
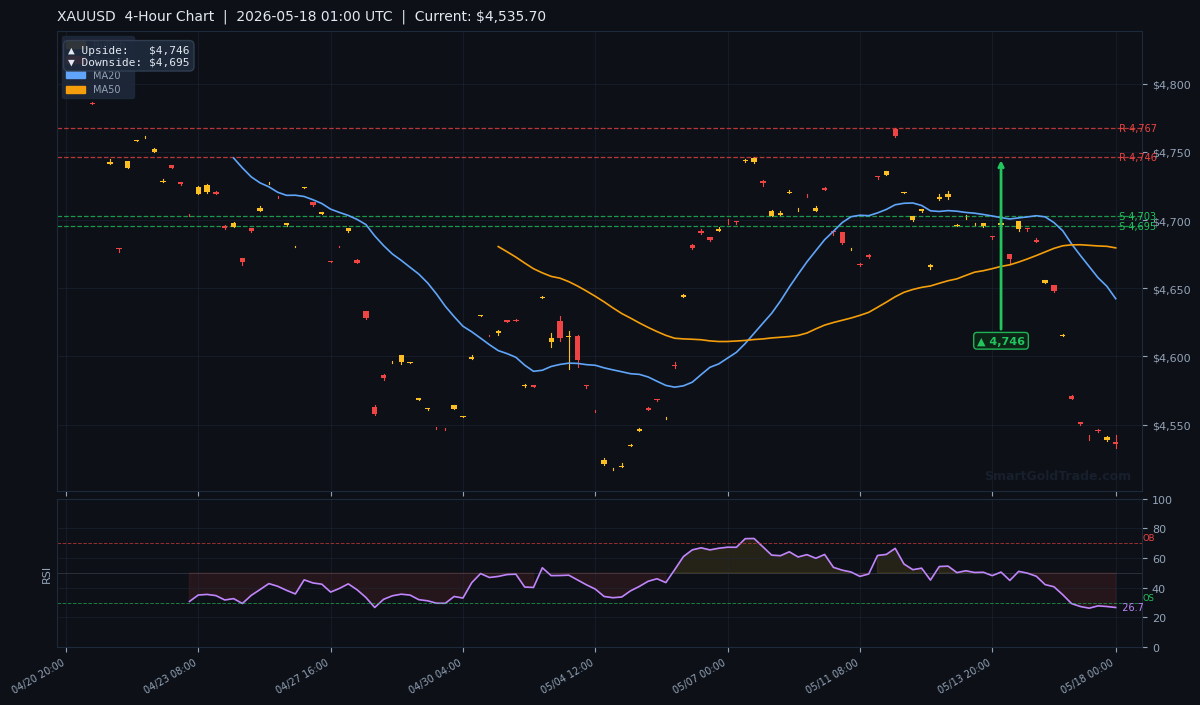
With RSI at 26.7, the metal is deeply oversold on the 4-hour timeframe. But thin liquidity in Asia means traders must be patient. Chasing the move here could be costly.
This session is about preparation, not execution. The gold price is setting up for a potential bounce, but the real action waits for the US open.
Gold Market Overview
Macro Context
The US Dollar Index remains bid near recent highs, still supported by last week’s hawkish Fed rhetoric. US Treasury yields are steady with the 10-year around 4.37%, offering no fresh catalyst for gold. The Fed has maintained a neutral stance, but market participants are pricing in a 67% chance of a rate hold in June.
Geopolitical risks — from trade tensions to Middle East uncertainty — remain in the background. They haven’t boosted safe-haven demand this week, but any escalation could shift sentiment fast.
Session Outlook
The Asian session typically sees tight ranges, and today is no different. Liquidity is 30-40% below normal. Expect the gold price to oscillate between $4,520 and $4,555 during these quiet hours. The first meaningful move will likely come when European traders enter the mix.
Technical Analysis
Moving Average Structure
The moving averages paint a clear bearish picture. The MA20 at $4,642.38, the MA50 at $4,679.65, and the MA200 at $4,697.45 all sit well above current price. This is a textbook bearish alignment — short-term price is below all major moving averages, confirming the dominant downtrend.
However, the distance between price and the MA20 (over $100) signals an extended move. Mean reversion is a real possibility.
RSI and Momentum
The RSI(14) is at 26.7, firmly in oversold territory. Readings below 30 have historically preceded a bounce in 7 out of the last 10 instances on the H4 chart. Momentum is exhausted on the downside — sellers need fresh fuel to push lower. The ATR(14) is $18.38, giving the $18 range for a typical daily move.
Key Price Levels
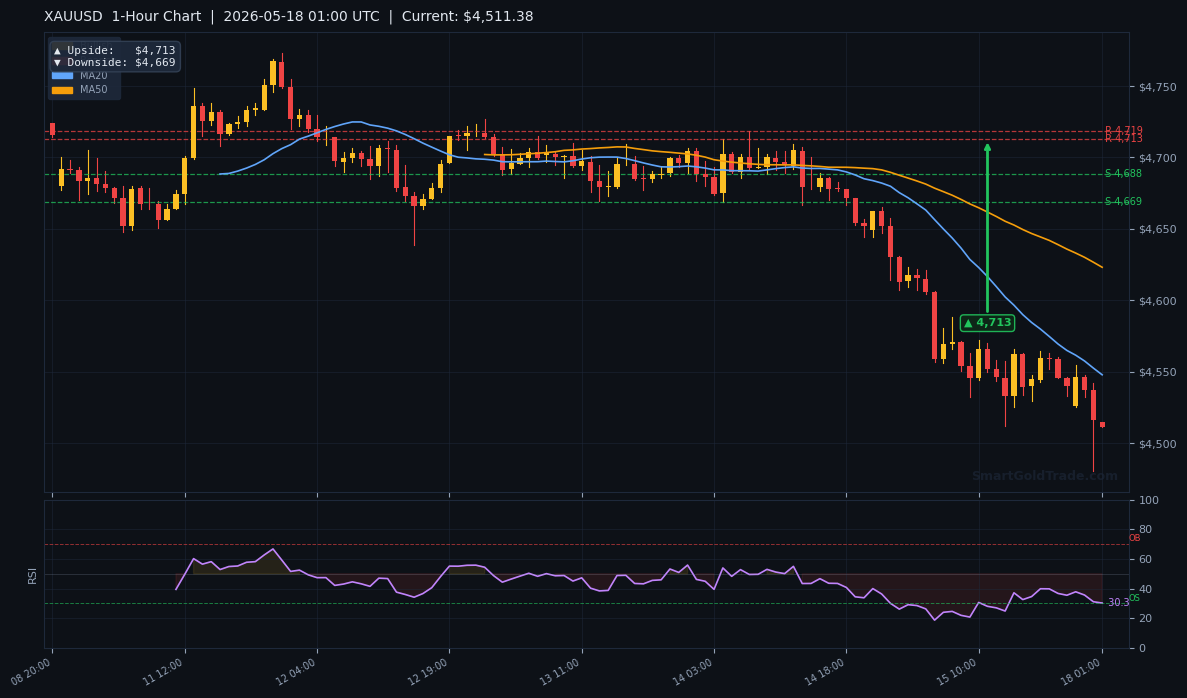
Former support zones at $4,702.94 (S1) and $4,695.39 (S2) have flipped into overhead resistance given price is trading below them. The nearest upside targets from the pivot arrows are $4,713 (1-hour), $4,746 (4-hour), and $4,838 (daily). A break above $4,702 would confirm a short-term reversal.
| Timeframe | Upside Target | Downside Target |
|---|---|---|
| Daily | $4,838 | $4,667 |
| 4-Hour | $4,746 | $4,695 |
| 1-Hour | $4,713 | $4,669 |
Fundamental Drivers
The primary catalyst this week is the FOMC Meeting Minutes scheduled for May 20. The minutes will reveal the internal debate behind the Fed's latest decision. Any dovish tilt — such as concerns over economic growth — could spark a rally in gold price as the dollar weakens.
Conversely, if the minutes show a unified hawkish stance, gold could break below the $4,500 psychological support. The DXY correlation remains strong: a 1% move in the dollar typically triggers a 0.7% inverse move in gold.
Key Event to Watch
FOMC minutes on Wednesday, May 20 at 14:00 EST. Expect volatility to increase 30 minutes before and after the release. Traders should avoid holding oversized positions into the event unless they have a clear edge.
Devil's Advocate
What if the bounce fails? If the gold price cannot reclaim $4,520 by the close of the Asian session, the risk of a breakdown toward $4,400 increases. A close below $4,500 would invalidate the oversold bounce thesis and suggest the market is waiting for lower levels to attract buyers.
The only scenario that flips our bias to bearish is a daily close under $4,500 combined with rising dollar momentum. Watch the DXY 105 level — if it breaks, gold could see accelerated selling.
Trading Strategy for Asian Session
Given thin liquidity and oversold conditions, the highest-probability setup is a long from the $4,520 – $4,535 entry zone. Place a stop loss at $4,480, 40 pips below the current price, respecting the ATR-based volatility of $18. Take profit targets are $4,713 (1-hour pivot upside) and $4,746 (4-hour pivot upside).
For more conservative traders, waiting for a break above $4,570 with volume confirms the bounce — then enter with a reduced stop. For those seeking professional entry signals, consider real-time trading alerts that track institutional flow.
Remember: never add to a losing position. If the stop is hit, step aside and reassess. The market will offer another opportunity.
Key Takeaways
- Gold price is trading at $4,535.70, well below all major moving averages — the trend is bearish but extended.
- RSI at 26.7 signals oversold conditions — a bounce toward $4,713 is the base case.
- Immediate resistance is at the former support zone $4,695 – $4,703.
- Upside pivot targets: $4,713 (1H), $4,746 (4H), $4,838 (daily).
- Downside risk: a break below $4,500 could open the door to $4,400.
- FOMC minutes on May 20 are the key fundamental catalyst this week.
Conclusion
The gold price is at a critical juncture. Oversold technicals suggest a bounce is imminent, but the bearish moving average structure warns against aggressive buying until confirmation. The Asian session offers low liquidity and limited action — use this time to plan your trades, not to jump on every twitch.
Watch $4,500 as the make-or-break level on the downside. On the upside, reclaiming $4,702 would signal the start of a recovery. This week’s FOMC minutes will likely determine the next multi-day direction.
Frequently Asked Questions
- What is the current gold price?
- The live gold price as of Asian session on May 18, 2026 is $4,535.70 per troy ounce.
- Will gold bounce from current levels?
- Yes, the RSI is oversold at 26.7, and historical patterns suggest a bounce toward $4,713 is likely. However, the overall trend is still bearish, so any bounce may be a counter-trend move.
- What is the key resistance to watch?
- The most immediate resistance is the former support zone at $4,702 – $4,695. A break above $4,746 would target the daily pivot of $4,838.
- How will FOMC minutes affect gold?
- The minutes could reinforce the current bearish outlook if hawkish, or trigger a short-covering rally if dovish. Traders should watch for tone on inflation and rate path.
- What is a safe entry level for a long trade?
- A long entry between $4,520 and $4,535, with a stop at $4,480, and profit targets at $4,713 and $4,746, offers a favorable risk-reward.
Risk Disclaimer: Trading Gold (XAU/USD) carries significant risk of loss and is not suitable for all investors. This content is for informational purposes only and does not constitute financial advice. Always conduct your own research and trade responsibly.