Gold price started Friday's European session at $4,179.61 and has since nudged higher to $4,183.15, extending the firm tone that took hold after yesterday's yen shock. The Japanese currency surged on July 2 following what traders widely flagged as direct Bank of Japan intervention, sending EUR/JPY nearly 0.5% lower to around 184.00 and sparking a fresh safe‑haven bid for precious metals.
With London liquidity now flowing, XAUUSD is pressing toward the $4,200 neighborhood and eyeing the $4,207 resistance that has capped several recent rallies. If the dollar stays on the back foot, a decisive breakout could unfold this afternoon.
Gold Price Market Overview
Macro Context
The US Dollar Index slipped roughly 0.15% overnight to 101.90 as yen strength and a dip in the 10‑year Treasury yield to 4.21% sapped dollar demand. Fed funds futures still price a roughly 60% probability of a rate cut by December, keeping the non‑yielding metal supported. Meanwhile, simmering geopolitical risks—including Middle East tensions and the prolonged Ukraine conflict—continue to supply a safety bid. All these factors are providing a favourable macro backdrop for the gold price.
Session Outlook
European trade is set for above‑average volatility as London desks absorb the fallout from yesterday's intervention. Historically, the gold price often probes session extremes during this window.
With the gold price at $4,183, comfortably above the $4,176 pivot, short‑term momentum remains intact. The bias leans bullish as long as support between $4,183 and $4,165 holds.
A clean push beyond $4,207 would open the door to $4,230, while a failure to defend $4,165 would shift focus to $4,139. Today's economic calendar is light, so FX‑driven flows and technical triggers will dominate.
Technical Analysis
Moving Average Structure
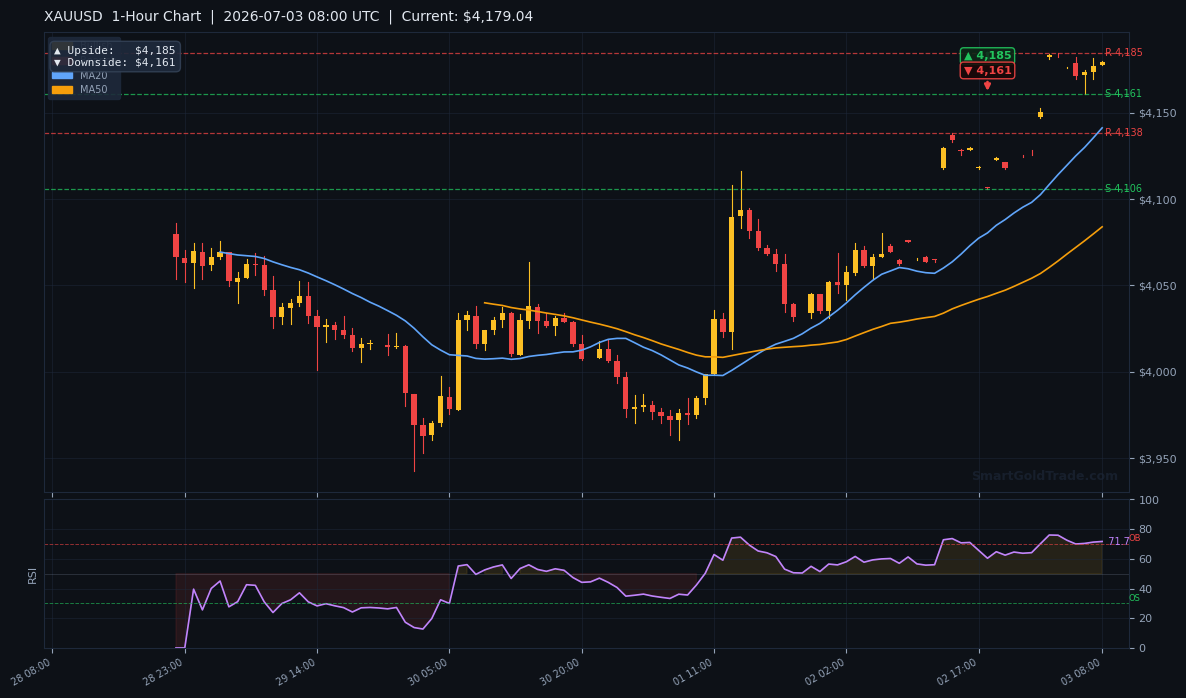
The 20‑period moving average reads $4,049.50, the 50‑period stands at $4,050.54, and the 200‑period sits far above at $4,297.97. With the gold price at $4,176.60 at the start of the session, it trades comfortably above both the 20 and 50 MAs, confirming short‑term bullish momentum.
However, the MA20 remains below the MA50, creating a short‑term bearish pressure bias that the current rally is attempting to reverse. The gap to the 200 MA underscores that this is still a bear‑market correction until that long‑term average is reclaimed.
RSI and Momentum
The 14‑period RSI registers 67.1, sitting in neutral territory but edging toward overbought. This level signals the gold price has additional upside before exhaustion sets in, with a break above 70 confirming strong bullish momentum. A pullback toward the 60–65 zone would represent a healthy reset and could offer better entry opportunities for trend followers.
Key Price Levels
Support stands at S1 $4,182.58 and deeper at S2 $4,139.90. Resistance is layered at R1 $4,207.82 and the unusually positioned R2 $4,139.37 (a relic of a prior pivot calculation). The ATR of $27.97 implies a daily range of roughly $4,155 to $4,211, neatly bracketing the S2 base and the R1 ceiling.
Multi‑Timeframe Pivot Table
| Timeframe | Upside Pivot | Downside Pivot | Nearest S/R |
|---|---|---|---|
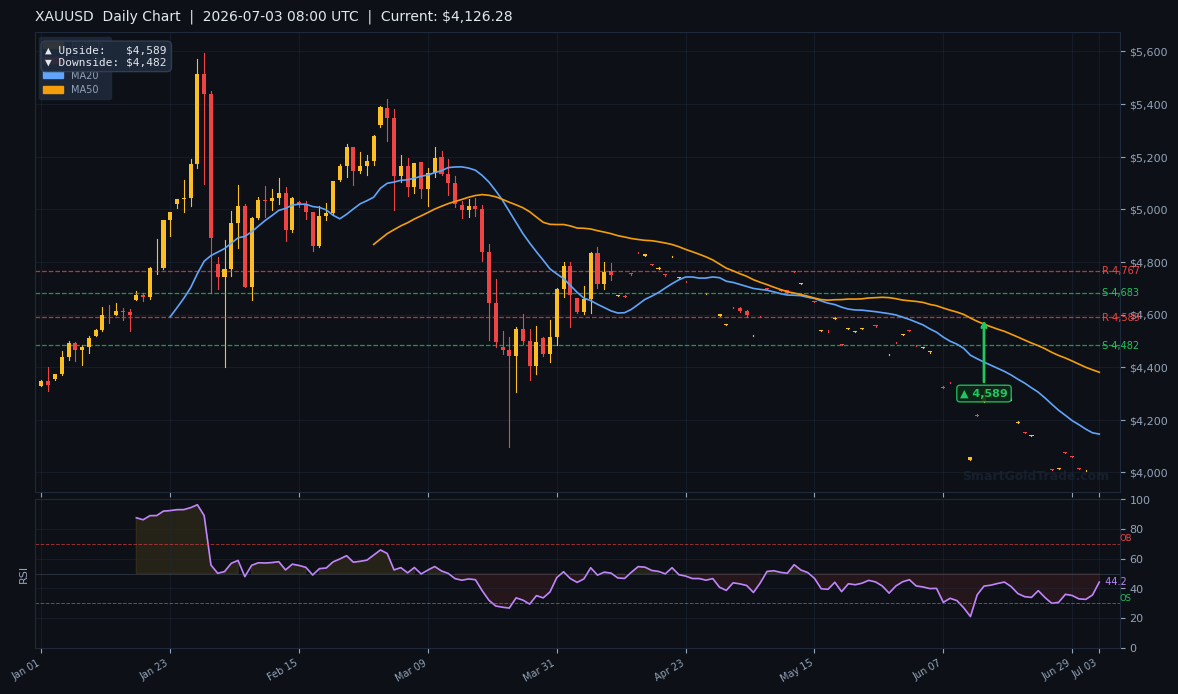
| Daily | $4,589 | $4,482 | — |
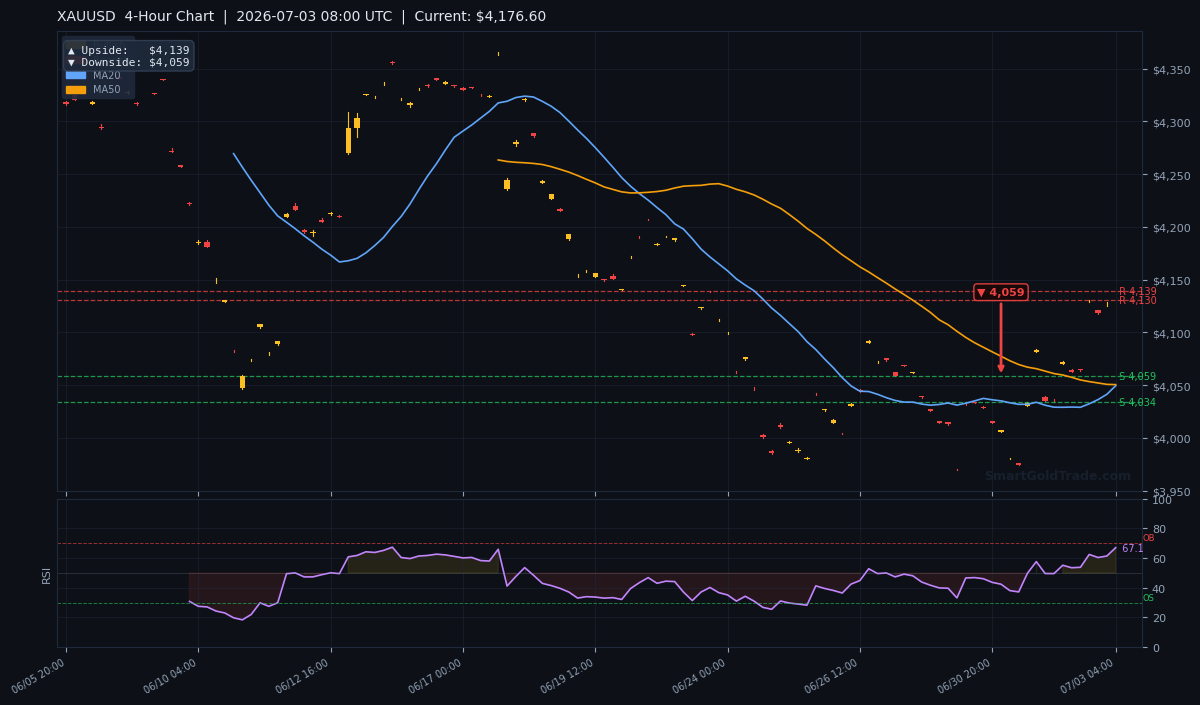
| 4‑Hour | $4,139 | $4,059 | S2 $4,139.90 / R2 $4,139.37 |
| 1‑Hour | $4,185 | $4,161 | S1 $4,182.58 |
Fundamental Drivers
The dominant story this morning is the Bank of Japan’s intervention, which sent the yen rocketing higher and ignited a classic risk‑off move that lifted the gold price. A stronger yen typically pressures the broad dollar, and the DXY’s drop after the intervention gave gold a clear tailwind.
With US real yields still elevated but off their highs, the gold price’s appeal as an alternative store of value has increased. Geopolitics add a constant layer of support, and any further FX instability will likely keep safe‑haven flows pointed toward the yellow metal.
Physical Gold: A Shariah‑Friendly Way to Capture the Gold Price
When safe‑haven demand drives the gold price higher, many investors prefer tangible assets that avoid interest and complex derivatives. You can purchase physical gold coins and bars directly from SmartGoldTrade, gaining full exposure to gold price appreciation in a Shariah‑compliant manner without the need for CFDs or swap fees.
Key Event to Watch
This week’s calendar remains thin, leaving the gold price at the mercy of dollar movements and any fresh intervention headlines. The next high‑impact release is next Monday’s ISM Services PMI for June. A weaker‑than‑expected reading would reinforce Fed rate‑cut expectations and boost the gold price, while a strong figure could reignite dollar demand and challenge the metal’s grip on the $4,183 region.
Devil's Advocate
The bullish view could unravel quickly if the dollar stages a sharp reversal—perhaps on hawkish weekend Fedspeak or a sudden spike in Treasury yields above 4.30%. A break below cluster support at $4,139 (where the 4‑hour pivot downside and S2 converge) would signal that sellers have seized control of the gold price. Ultimately, a daily close beneath the 50‑day moving average at $4,050.54 would flip the medium‑term picture back to bearish.
Gold Price Trading Strategy for the European Session
For the London window, entry is preferred on a slight pullback into the $4,179–$4,183 zone, leaning on the S1 pivot at $4,182.58 as confirmation.
Set a stop loss below the ATR‑adjusted noise floor at $4,135, giving the trade room to breathe below S2 at $4,139.90. Initial take‑profit sits at $4,207, with a secondary target at $4,230 if momentum accelerates. This setup offers a risk‑reward ratio of roughly 1:2.5.
For those without a plan, professional gold trading signals can deliver precise entry alerts based on these exact levels. And if you prefer to avoid overnight swap fees, interest‑free spot gold trading provides a Shariah‑compliant route to ownership.
Key Takeaways
- Gold price sits at $4,183.15, benefiting from post‑intervention risk aversion after opening at $4,179.61.
- Immediate resistance is $4,207.82; a break targets $4,230.
- H4 support rests at $4,182.58 (S1) and $4,139.90 (S2).
- RSI at 67.1 leaves room for upside before overbought conditions emerge.
- ATR of $27.97 projects a session range near $4,155–$4,211.
- A drop below $4,139 would invalidate the bullish bias.
Conclusion
The European session bias is bullish above $4,165, with the yen‑intervention fallout still providing tailwinds for the gold price. A decisive close above $4,207 would confirm the breakout and set the stage for a move toward $4,230.
However, traders must stay alert to any dollar recovery that could quickly unwind gains. The path of least resistance points higher, but discipline around risk levels is essential in this fast‑moving environment.
Frequently Asked Questions
- What is the key gold price level to watch today?
- Resistance at $4,207.82 is the line in the sand. A sustained break above it could extend the rally toward $4,230, while a failure to clear it may lead to a pullback toward $4,165.
- How did the yen intervention affect the gold price?
- The yen’s sharp rise on July 2 weakened the broad dollar and sparked a safe‑haven bid that pushed the gold price from near $4,150 into the $4,183 area. Currency‑driven flows remain a key driver today.
- What is today's expected trading range?
- Based on the ATR of $27.97, the likely range spans roughly $4,155 (near S2) to $4,211 (near R1). Intraday swings within this band are normal.
Risk Disclaimer: Trading Gold (XAU/USD) carries significant risk of loss and is not suitable for all investors. This content is for informational purposes only and does not constitute financial advice. Always conduct your own research and trade responsibly.