
The gold price is trading at $4,308.40 as the American session gets underway on June 16, 2026, with the market consolidating just below the 200-day moving average. Last week's PPI and CPI data confirmed persistent inflationary pressures, forcing traders to reassess the Fed's rate path. Today's session focuses on pure price action, and a clean break above immediate resistance could set the stage for a move toward the $4,350 zone.
Traders are balancing short-term bullish momentum against longer-term overhead resistance. The market is reacting to a firmer US dollar and stable Treasury yields in early New York trading. This session's range will be dictated by institutional flows and any unscheduled geopolitical headlines. Heightened volatility is expected as the gold price approaches the $4,320 technical barrier.
Gold Price Market Overview
Macro Context
The US Dollar Index (DXY) remains a primary driver, showing resilience despite last week's mixed economic data. The 10-year Treasury yield is holding steady, suggesting bond markets are in a wait-and-see mode ahead of more Fed commentary. Market positioning shows speculative net longs in gold have increased, but not at overcrowded levels.
Geopolitical risk premiums, while present, have receded from recent highs. This places greater emphasis on traditional macroeconomic drivers like real yields and dollar strength. The Fed's blackout period ahead of its next meeting means price action will be driven by technicals and liquidity rather than new policy hints.
Session Outlook
The American session typically brings the day's highest liquidity and most decisive moves. With no tier-1 economic data scheduled for today, we expect the gold price to respect the technical levels outlined below. The expected daily range, based on the ATR of $32.60, is approximately $4,278 to $4,339. A breakout from the current consolidation could extend that range toward the $4,350 resistance.
Watch for momentum to build through the early afternoon in New York. A failure to break higher on good volume could trigger profit-taking and a pullback toward the session's opening levels. The key trigger will be how price behaves at the $4,320.40 level—the 200-day moving average.
Gold Price Technical Analysis
The technical picture presents a conflict between short-term momentum and long-term trend resistance. The current gold price of $4,308.40 sits above the short- and medium-term averages but squarely below the primary long-term trend line.
Moving Average Structure
The MA20 at $4,291.15 and the MA50 at $4,248.90 both slope upward, with price trading above them. This confirms a bullish short- to medium-term bias. The MA200, however, at $4,320.40, looms just overhead. Price is currently below this level, placing it in bearish territory on the long-term chart. The structure of MA20 > MA50 signals that short-term momentum remains intact.
RSI and Momentum
The RSI(14) reads 52.0, firmly in neutral territory. This indicates there is room for the upside to extend before conditions become overbought. It also suggests the recent advance has been orderly rather than driven by frantic buying. The RSI level supports either a continuation higher or a brief pause without signaling an imminent reversal.
Key Price Levels
Immediate support is defined by S1 at $4,274.50, with stronger support at S2: $4,210.80. The first line of resistance is R1: $4,351.70, though the more immediate hurdle is the cluster near $4,345. The ATR of $32.60 suggests a normal daily range of about $65 from high to low, which projects a potential session high near $4,338 and a low near $4,273 if price remains range-bound.
| Timeframe | Upside Target | Downside Target |
|---|---|---|
| Daily (D1) | $4,410 | $4,210 |
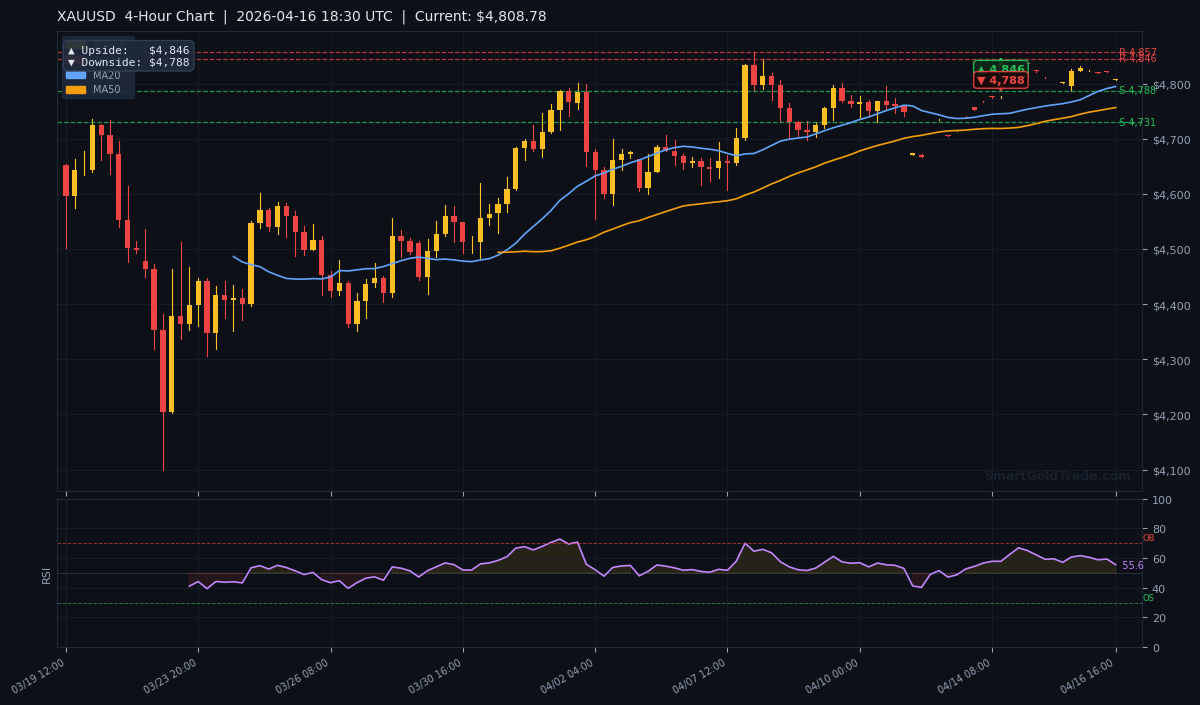
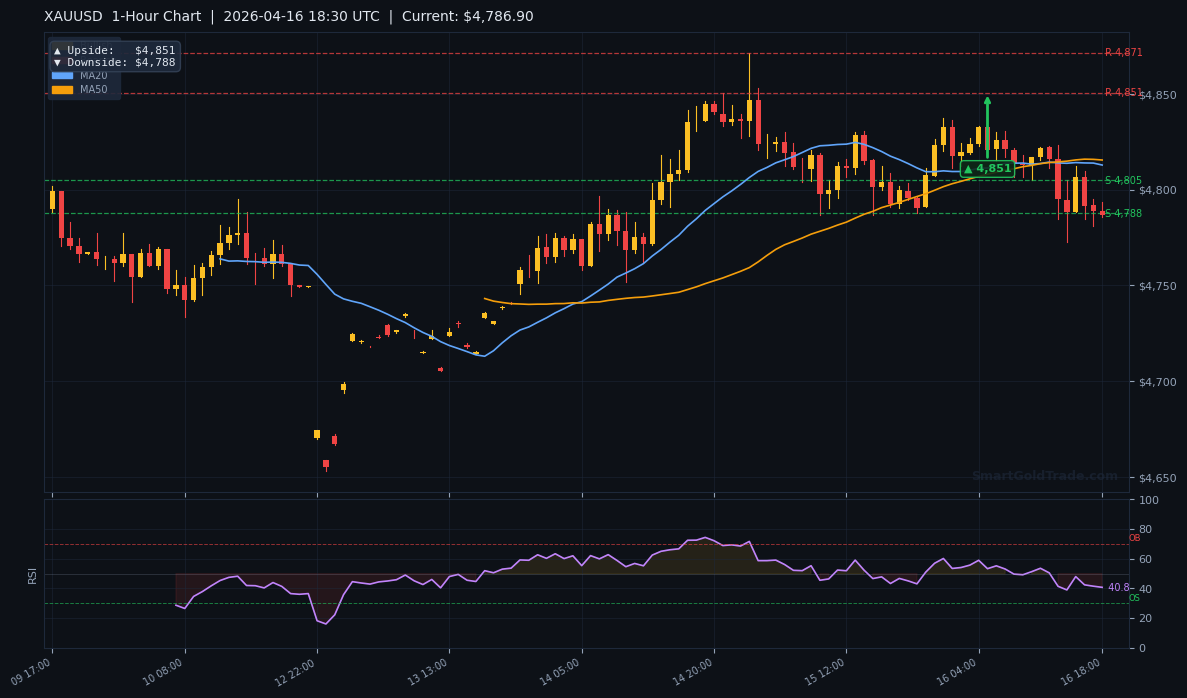
| 4-Hour (H4) | $4,345 | $4,274 |
| 1-Hour (H1) | $4,350 | $4,274 |
Fundamental Drivers
The primary fundamental narrative remains the market's assessment of the Federal Reserve's next move. Last week's inflation data ruled out imminent rate cuts, but also did not suggest a need for additional tightening.
This has created a neutral-to-supportive backdrop for gold, as real yields have stabilized. The latest market analysis highlights that bulls will find resistance near the $4,350 area, a level that aligns perfectly with our technical resistance at $4,345. This convergence of views reinforces the importance of that zone.
The US dollar's correlation with gold has been negative but inconsistent. Any sudden spike in the DXY, perhaps from a flight-to-quality bid, could temporarily cap the gold price. However, the dominant driver remains the market's inflation and real interest rate outlook.
Key Event to Watch
This week, traders will watch for any scheduled speeches from Federal Reserve officials now that the blackout period has ended. Their commentary on last week's inflation prints will be critical. Any hint that the Fed is becoming more concerned about sticky inflation could boost gold as a hedge, while dismissive comments on the data could strengthen the dollar and pressure metals.
Devil's Advocate
The bullish momentum is clear, but it faces a formidable wall at the 200-day moving average ($4,320.40) and the $4,345 resistance cluster. A rejection from this zone, accompanied by a drop below the $4,274.50 support, would invalidate the immediate upside bias. Such a move would signal that buyers lacked conviction at a critical level and a deeper pullback could quickly unfold.
The scenario that flips the trade bearish is a close below $4,274.50 on the H4 chart. This would break the short-term higher low structure and likely trigger a retreat toward the $4,248 MA50 support. The neutral RSI at 52.0 means a reversal lower would not need to overcome overbought conditions, making the downside vulnerable if resistance holds.
Trading Strategy for American Session
For bullish traders, the optimal entry zone is on a pullback to the support confluence between $4,291 (MA20) and $4,274.50 (S1). A stop loss should be placed just below $4,270, using the ATR to allow for normal volatility. The primary take-profit target is the $4,345 resistance, with a secondary target at $4,350. For those who prefer expert-analyzed entry points, subscribing to professional gold trading signals can help confirm these technical setups.
For a breakout strategy, a move above $4,320.40 (MA200) with confirming volume could be used as a signal to enter long. In this case, a tighter stop below $4,308 (the breakout level) would be appropriate, targeting the same $4,345 to $4,350 zone. Risk-reward on both setups exceeds 1:2, making them viable for the session.
Conservative traders may wait for a clear break and close above $4,345 before committing to new long positions, targeting the daily pivot at $4,410. Regardless of approach, position sizing must account for the elevated volatility indicated by the $32.60 ATR.
Key Takeaways
- The gold price stands at $4,308.40, trading above the MA20 ($4,291.15) and MA50 ($4,248.90) but below the key MA200 at $4,320.40.
- Immediate resistance is clustered between $4,345 and $4,350, while support rests at $4,274.50 and $4,210.80.
- The RSI at 52.0 is neutral, indicating the rally is not overextended and has room to run if resistance breaks.
- The 4-hour chart projects an upside target of $4,345, which aligns with broader market analysis of resistance near $4,350.
- A break below $4,274.50 would invalidate the short-term bullish structure and target a move to the MA50.
- Expected daily volatility range is approximately $65, based on the ATR of $32.60.
- Long-term investors seeking Shariah-compliant exposure can build positions gradually through our Shariah-compliant gold investment pools, aligning with ethical wealth preservation.
Conclusion
The gold price is at an inflection point. Bullish momentum from the moving average structure is pressing against the significant long-term resistance of the 200-day MA and the $4,345 zone. The outcome of this battle will set the tone for the coming days. A successful breakout opens a clear path toward the $4,350s, while a rejection could see a swift retreat to the $4,274 support area.
Traders should monitor price action around $4,320 and $4,345 with heightened attention. The American session's liquidity will provide the energy for the next directional move. The bias is cautiously bullish above $4,274, but respect for the overhead resistance is mandatory. For those interested in executing gold trades in a Shariah-compliant manner, our halal gold trading platform offers spot metal ownership without interest or leverage.
FAQ
What is the most important level for the gold price right now?
The 200-day moving average at $4,320.40 is the key level. A sustained break above it would signal a potential shift in the long-term trend, while a rejection would reinforce its role as major resistance for the gold price.
Where should I place a stop loss if I'm long gold?
For a long position entered near current levels, a logical stop loss is below the $4,274.50 support. This level marks the recent swing low and the S1 pivot, providing a clear invalidation point for the bullish setup.
What is the next major target if the gold price breaks higher?
The immediate target is $4,345 (4-hour upside pivot). Beyond that, the next significant resistance zone begins at $4,351.70 (R1). The daily chart suggests a much larger target at $4,410 if a major breakout occurs.
Trading Gold (XAU/USD) carries significant risk of loss and is not suitable for all investors. This content is for informational purposes only and does not constitute financial advice.