
The gold price is trading at $4,344.56 as the American session unfolds on June 16, 2026. The metal is consolidating after last week's volatile trading spurred by shifting expectations around Federal Reserve policy. Despite the recent pullback, gold is holding above key short-term moving averages, suggesting that the underlying bid remains intact. This session will reveal whether bulls can reclaim the $4,370 region or if a deeper retracement toward support near $4,310 is in store.
Gold Price Market Overview
The gold price navigates a landscape dominated by a resilient US dollar and steady Treasury yields. While immediate rate hike fears have subsided, the Fed's data-dependent stance continues to lend support to the Dollar Index, creating a headwind for dollar-priced gold. Geopolitical tensions, though ever-present, have faded as the primary driver for now, shifting attention squarely onto macroeconomic indicators. For Islamic investors, using a halal gold trading platform ensures that every trade is riba-free and backed by physical metal.
Macro Context
Last week’s US retail sales data surpassed expectations, reinforcing the narrative of economic resilience and keeping the “higher for longer” rate environment alive. Paired with stubborn inflation readings, the greenback has found fresh support. For the gold price, this means real yields remain relatively attractive, capping the metal’s upside unless this week’s FOMC decision delivers a dovish surprise or upcoming data turns notably softer.
Session Outlook
The American session typically brings heightened liquidity, and with no top-tier economic data scheduled for release today, price action will be dictated by technical flows and positioning ahead of the Fed. Based on the current ATR(14) reading of $14.50, the projected daily volatility range for the gold price spans roughly $4,318 to $4,372. Traders should watch for a breakout from the current consolidation as institutional order flow congregates around identified support and resistance levels.
Gold Price Technical Analysis
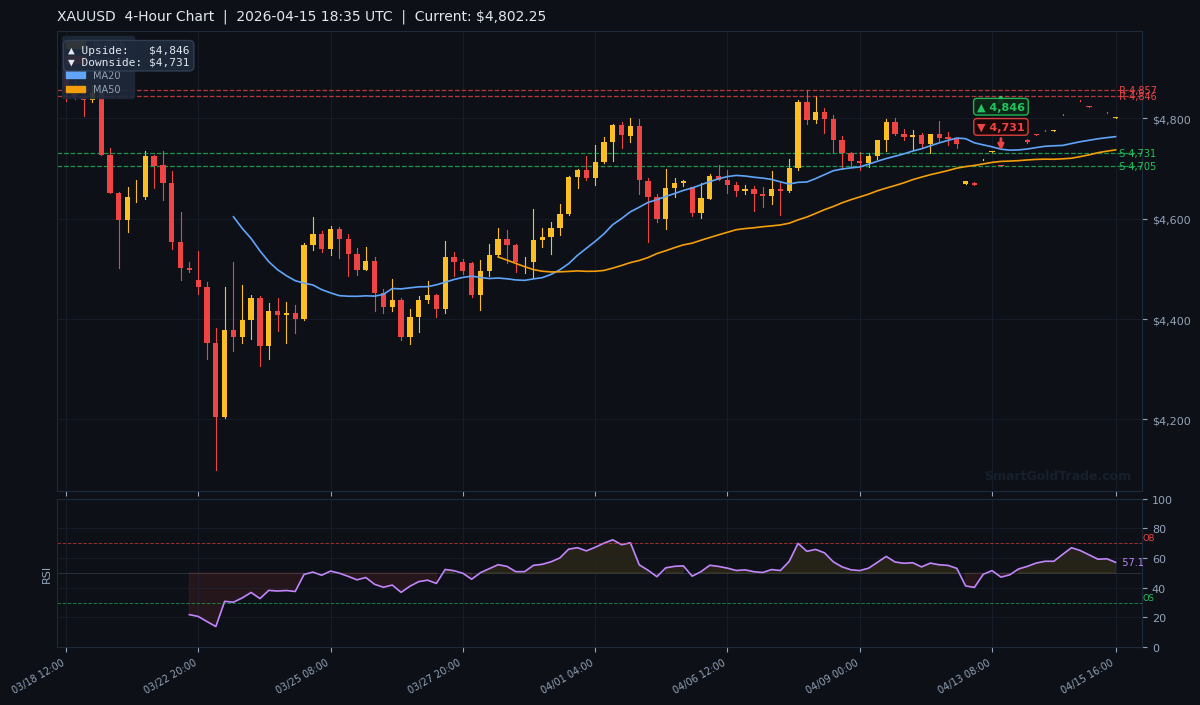
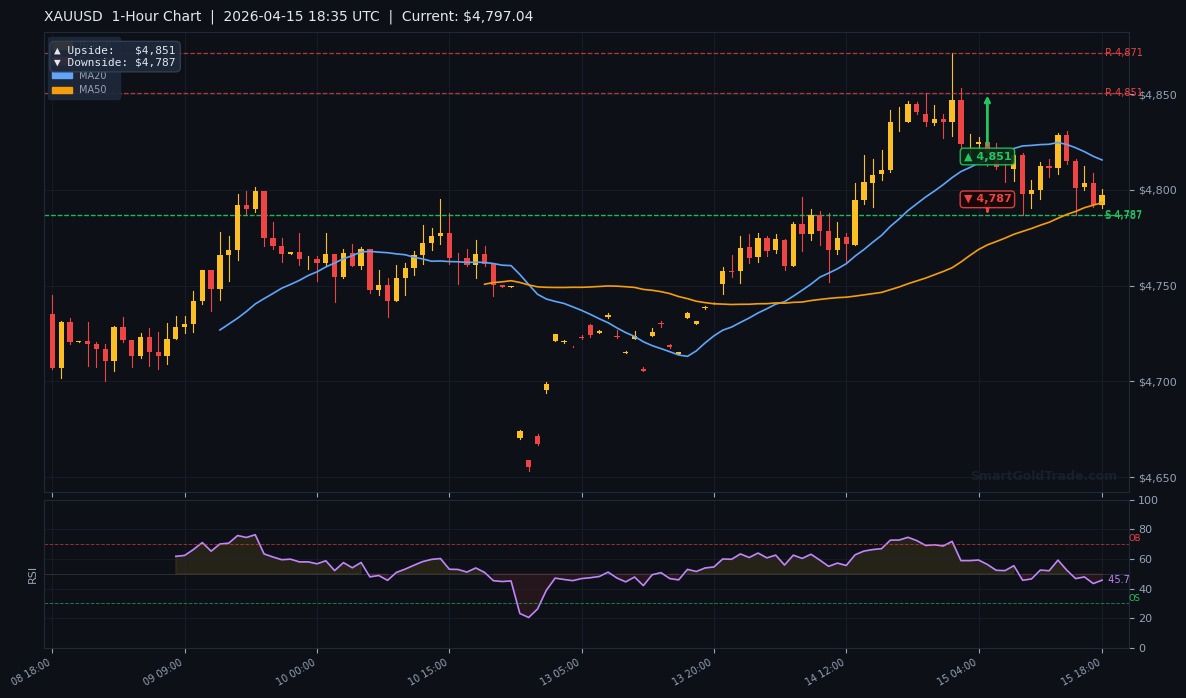
Gold price charts depict a mixed but actionable picture. The metal sits above its shorter-term moving averages but remains capped by the long-term 200-period moving average. With the RSI(14) at 55.4, neither bulls nor bears are at an extreme, leaving ample room for the next directional leg. The stage is set for a decisive move once either support or resistance gives way.
Moving Average Structure
The 20-period MA stands at $4,316 and the 50-period MA at $4,286, both sloping higher and positioned below the current price. This alignment provides dynamic support in the near term. However, the 200-period MA looms at $4,387, keeping the gold price just below it from a longer-term perspective. The bullish crossover where the 20-MA rose above the 50-MA reinforces the short-term upward bias, though a daily close above the 200-MA is needed to confirm a genuine trend reversal.
RSI and Momentum
With an RSI value of 55.4, momentum is squarely in neutral territory. Buyers haven’t overextended, and there is no oversold condition to fuel an automatic bounce. A push above 60 would strengthen the bullish narrative, while a dip below 50 would shift the intraday advantage to sellers. This neutral posture often precedes a sharp move once a catalyst appears.
Key Price Levels
With the gold price at $4,344.56, immediate resistance is seen at $4,357 (R2) and $4,370 (R1), the latter being the more significant ceiling. On the downside, initial support rests at $4,320 (S1), followed by a stronger floor at $4,295 (S2). The 14-period Average True Range of $14.50 quantifies recent market noise and offers a practical yardstick for stop-loss placement, implying a daily swing of roughly $29.
| Timeframe | Upside Target | Downside Target |
|---|---|---|
| Daily (D1) | $4,450 | $4,150 |
| 4‑Hour (H4) | $4,370 | $4,295 |
| 1‑Hour (H1) | $4,350 | $4,320 |
Fundamental Drivers of the Gold Price
The main driver for the gold price remains the US monetary policy outlook and its impact on the dollar. Last week’s robust retail sales data underscored the economy’s resilience, keeping Fed officials cautious about cutting rates. For gold, this creates a tug-of-war: a strong economy supports physical demand, but the resulting firm dollar and positive real yields act as headwinds. Any signal from this week’s FOMC that a rate cut could come sooner than expected would likely boost gold.
The negative correlation with the US Dollar is the most immediate fundamental relationship. A softer-than-expected CPI print or dovish Fed statements could spark a dollar pullback, providing a direct tailwind for the gold price. Conversely, a hawkish surprise that keeps rates higher for longer would pressure gold back toward its recent lows.
Physical demand from central banks and retail buyers also influences the gold price. In 2026, central bank purchases have remained elevated, providing a structural floor. Meanwhile, gold’s safe-haven appeal continues to attract investors during bouts of equity market stress. For those who prefer direct ownership, physical gold products offer a tangible hedge against inflation and currency debasement.
Key Event to Watch
Traders are squarely focused on the Federal Reserve’s June policy meeting concluding this Wednesday. While rates are universally expected to stay on hold, the updated dot plot and Chair Powell’s press conference will be scrutinized for any shift in the projected rate path. A reduction in the 2026 median dot or explicit mention of easing inflation could reignite gold’s appeal. On the other hand, a reiteration of the “higher for longer” mantra would extend the greenback’s strength and weigh on the gold price.
Devil’s Advocate
The short-term bias is cautiously bullish, but risks are tilted to the downside. A failure to breach the 200-period MA at $4,387 could invite fresh selling and a retest of the $4,320 support. Should the Fed deliver unexpectedly hawkish guidance, the dollar could surge, hammering the gold price below the $4,295 floor and invalidating the near-term constructive structure. Such a move would likely expose the $4,200 psychological level.
Trading Strategy for Today’s Gold Price
Given the bullish short-term moving average alignment and neutral RSI, a buy-on-dips approach seems prudent. Look for entries near the support cluster between $4,320 (S1) and the 20-period MA at $4,316. Place a stop loss below the S2 level at $4,288 to allow for market noise, equating to a risk of roughly $32. The initial profit target is the H4 resistance at $4,370, offering a risk-reward ratio of about 1:1.7.
A more aggressive strategy would be to enter on a confirmed 1-hour close above $4,355, targeting a run toward the 200-period MA at $4,387. In that case, a stop loss could be set below the breakout candle’s low, near $4,335. For traders who rely on systematic approaches, a price action trading system for gold can assist in detecting candlestick patterns and supply-demand zones without emotional bias.
Key Takeaways
- The gold price at $4,344.56 is supported by a bullish 20-MA > 50-MA crossover but faces resistance near the 200-MA at $4,387.
- The RSI(14) reading of 55.4 is neutral, providing room for the next directional move.
- Key resistance to watch is at $4,370 (H4 target), with major support situated at $4,295 (S2).
- The market’s expected daily range, based on an ATR(14) of $14.50, is approximately $29.
- A buy-on-dips strategy favors entries near $4,320–$4,316 with a stop below $4,288 and a target of $4,370.
- A break below $4,295 support would shift the near-term bias to bearish, exposing the $4,200 zone.
Conclusion
The gold price is at a critical technical juncture as the American session kicks off on June 16, 2026. The short-term setup offers a defined opportunity with a bullish target of $4,370, provided the metal holds above the $4,320 support band. While longer-term trend signals remain mixed due to the price’s position below the 200-day average, the near-term momentum is constructive. Success hinges on the ability to absorb any dollar strength and clear the $4,370 resistance, which could open the door toward the 200-MA at $4,387.
Frequently Asked Questions
- What is the main resistance for the gold price today?
- The pivotal resistance sits at $4,370, which aligns with the 4-hour target and is just below the 200-period moving average at $4,387.
- Where should I place a stop loss if I am bullish on gold?
- A logical stop loss for a long position is below the $4,288 level, just under the S2 support. This accounts for normal daily swings and protects against a false breakdown.
- Is gold in an uptrend or downtrend right now?
- The trend is timeframe dependent. Short-term, gold holds above rising 20- and 50-period MAs, indicating bullish momentum. However, the price remains below the 200-period MA, keeping the longer-term outlook cautious. A break above $4,387 would tilt the bias toward a sustained rally.