
The gold price is consolidating near $4,853.48 during the early American session on April 19, 2026, holding recent gains sparked by positive geopolitical developments. Last week's crucial peace talks have provided temporary market relief, tempering the safe-haven bid that had supported the metal. Today's focus shifts to the technical structure, with bulls now directly challenging the $4,857.30 resistance level as they attempt to extend the broader uptrend.
Gold Price Market Overview
Macro Context
The U.S. Dollar Index (DXY) has found tentative footing, which is applying mild counter-pressure to dollar-denominated gold. Treasury yields have been relatively stable this week, with markets continuing to digest the Federal Reserve's communicated path from recent meetings. The primary fundamental shift has been a reduction in acute geopolitical risk premium, as highlighted in last week's peace dialogue developments. This has shifted the market's primary driver from fear to a focus on monetary policy and real yields, and the gold price is now more sensitive to dollar gyrations than to headline anxiety.
Session Outlook
The American session is where decisive moves are often made, driven by institutional liquidity and reaction to real-time news flow. Expect volume to pick up significantly after the New York open, and the gold price could see a $20–$30 swing within the first two hours if traders react to any unscheduled Federal Reserve commentary. Given the Average True Range (ATR) reading of $15.54, the expected intraday trading range is approximately $31. The key trigger will be any unexpected headlines related to the recent peace process or new economic data that alters rate expectations.
Gold Price Technical Analysis
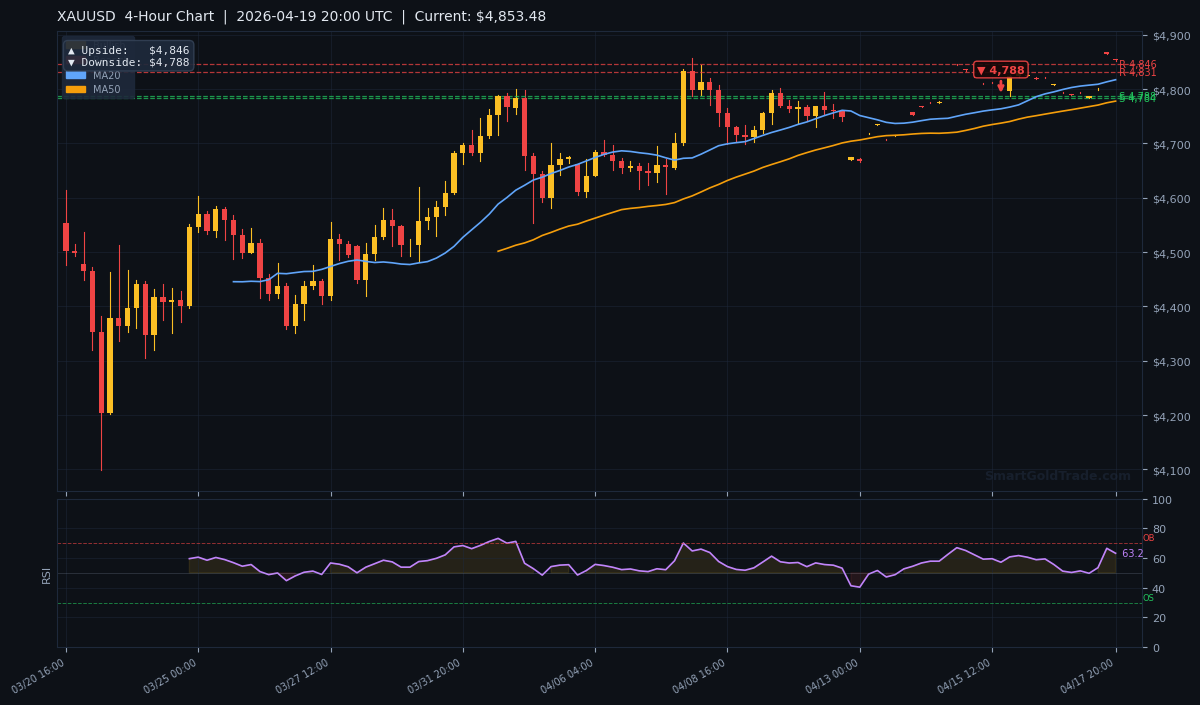
The technical picture for XAU/USD is firmly bullish across multiple timeframes, though short-term momentum is encountering a key resistance wall. The price action is trading above all major moving averages, confirming the underlying trend strength. The current RSI(14) reading of 63.2 suggests there is still room for advancement before the market enters overbought territory above 70.
Moving Average Structure
The moving average alignment paints a clear bullish picture. The gold price at $4,853.48 is above the MA20 at $4,817.17, the MA50 at $4,777.81, and the MA200 at $4,802.97. Critically, the MA20 is above the MA50, confirming short-term bullish momentum. This stacked, ascending structure provides a series of dynamic support levels on any pullback.
RSI and Momentum
The RSI at 63.2 is in neutral-to-bullish territory, meaning the gold price's advance is not yet extended. It is not overbought, which means the uptrend has fuel to continue without an immediate need for a major correction. A move above 70 would signal overbought conditions and increase the likelihood of a consolidation or pullback. For now, momentum favors the bulls as long as the RSI holds above the 50 mid-line.
Key Price Levels
Immediate resistance is clustered at $4,845.67 (R2) and $4,857.30 (R1). A clean break above R1 could accelerate gains. On the downside, the first significant support is at $4,787.61 (S1), followed by $4,784.22 (S2). The MA20 near $4,817 will also act as a nearby dynamic support. The daily expected range, based on the ATR, is roughly between $4,838 and $4,869.
| Timeframe | Upside Target | Downside Target |
|---|---|---|
| Daily | $5,250 | $5,014 |
| 4-Hour | $4,846 | $4,788 |
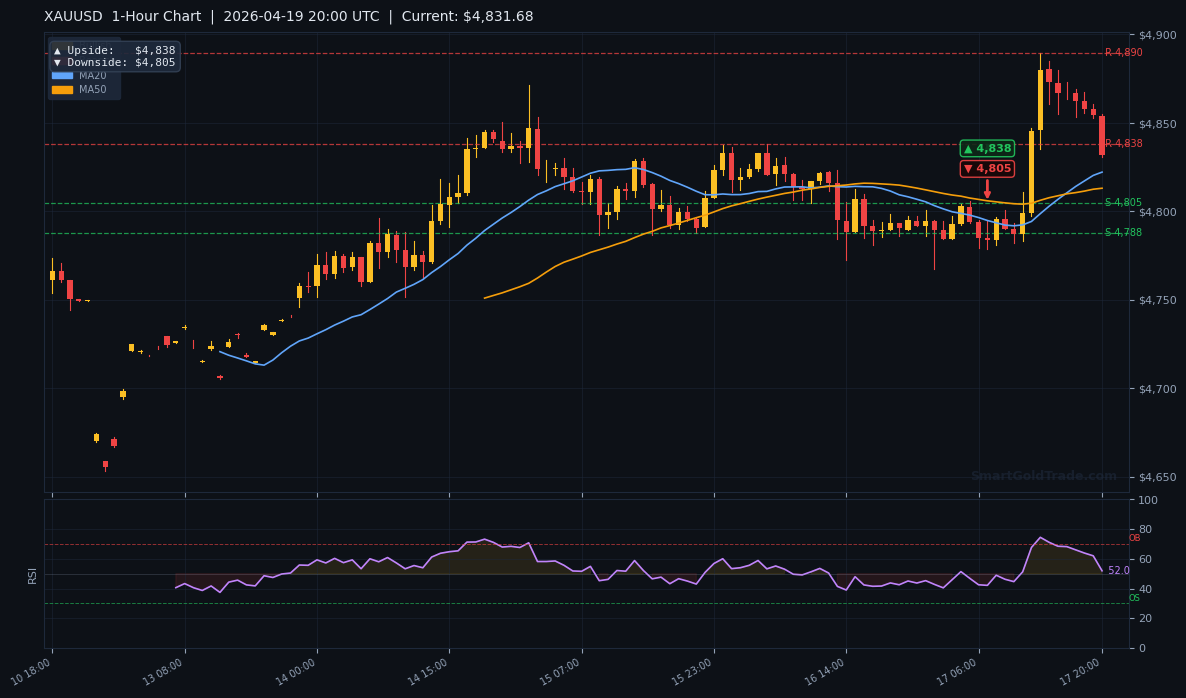
| 1-Hour | $4,838 | $4,805 |
Fundamental Drivers
The dominant fundamental theme this week is the market's reaction to last week's significant peace talks. This development has reduced the immediate geopolitical risk premium baked into gold, allowing other drivers like the dollar and real yields to take a more prominent role. The Fed's stance remains the bedrock driver; any shift in rhetoric towards greater hawkishness could strengthen the dollar and cap gold price rallies, while a dovish tilt would be strongly supportive.
Key Event to Watch
This week, traders will watch for any follow-up statements or developments from the parties involved in the recent peace negotiations. A reaffirmation of progress could continue to weigh on safe-haven flows. More importantly, scheduled speeches from Federal Reserve officials will be scrutinized for clues on the timing and pace of future policy adjustments, which directly influence the opportunity cost of holding non-yielding gold.
Devil's Advocate
The bullish structure is clear, but it is not infallible. The primary risk is that the relief rally from the peace news is fully priced in, leaving the market vulnerable to a 'sell the fact' scenario. A sharp, sustained rebound in the U.S. dollar, potentially from stronger-than-expected economic data, could trigger a corrective wave in the gold price. The key level that would begin to invalidate the immediate bullish bias is a sustained break below the $4,787.61 (S1) support. Such a move would likely target the MA50 near $4,777 and flip the short-term structure to neutral.
Trading Strategy for American Session
Given the bullish structure but proximity to resistance, the optimal strategy is to seek a long entry on a pullback to support, rather than chasing the price at current levels. A prime entry zone exists between the dynamic MA20 at $4,817 and the static S1 support at $4,787.61. An aggressive entry could be considered on a shallow dip toward $4,830. Place a stop loss below S1, around $4,775, using the ATR of $15.54 as a guide for risk.
The primary take-profit target is the $4,857.30 (R1) resistance. A confirmed break above this level opens the path toward the 4-hour chart upside target of $4,846 and eventually the daily target of $5,250. A more conservative approach is to scale out half the position at R1 and trail the stop for the remainder. For those who prefer to let professional setups do the heavy lifting, following expert-analyzed entry points via professional gold trading signals can remove emotional decision-making while keeping you aligned with the broader trend.
Gold Price and Halal Investing
For Muslim investors, tracking the gold price isn't just about profit—it's about preserving wealth in a completely Shariah-compliant way. Gold is a tangible, riba-free asset, and its price movements reflect the real purchasing power of savings over decades. Whether you're watching the gold price for a short-term trade or accumulating for long-term security, the principles of Islamic finance align naturally with this asset class. On our platform, you can act on the same technical levels discussed here through ethical structures, including Islamic partnership investment pools that share actual profits from physical gold without any interest or hidden fees.
Key Takeaways
- The gold price is at $4,853.48, trading above all key moving averages in a bullish configuration.
- Immediate resistance is at $4,857.30 (R1), with support at $4,787.61 (S1).
- The RSI at 63.2 is not overbought, suggesting room for further upside.
- Last week's peace talks have reduced geopolitical risk premium, shifting focus to dollar dynamics and Fed policy.
- The expected daily volatility range, based on an ATR of $15.54, is approximately $31.
- A break below $4,787.61 would be the first sign of a deeper correction toward the $4,777 MA50 support.
Conclusion
The path of least resistance for the gold price remains higher, supported by a bullish multi-timeframe technical structure. The key hurdle in the American session is a decisive close above the $4,857.30 resistance level. While fundamental tailwinds from geopolitics have eased, the underlying monetary backdrop and real yield environment continue to provide a supportive floor. Traders should monitor dollar strength closely, as a resurgent greenback is the most probable catalyst for a short-term pullback. The broader trend remains intact, favoring buying on dips toward the identified support zones for a continuation toward higher targets. For long-term investors, this technical strength reinforces gold's role as a core holding, accessible through our platform to purchase physical gold directly and hold a tangible, zero-leverage asset that mirrors every move of the gold price.
Frequently Asked Questions
- Is gold overbought at current levels?
- No, the RSI reading of 63.2 is in neutral territory. Gold is considered overbought when the RSI sustains above 70, which suggests there is still potential for this rally to extend.
- What is the most important support level to watch?
- The most critical support is at $4,787.61 (S1). A sustained break below this level would signal a failure of the recent breakout and likely lead to a deeper test of the $4,777 area.
- How does the peace talk news affect gold long-term?
- It reduces the short-term geopolitical risk premium, which can lead to consolidation or pullbacks. However, long-term gold trends are driven more by monetary policy, inflation expectations, and currency debasement fears, which remain intact.
- What is a realistic target if gold breaks above $4,857?
- A confirmed break above $4,857.30 opens the door to the next significant resistance area near the 4-hour chart target of $4,846, with the larger daily chart structure pointing toward $5,250.
Trading Gold (XAU/USD) carries significant risk of loss and is not suitable for all investors. This content is for informational purposes only and does not constitute financial advice. Always conduct your own research and trade responsibly.