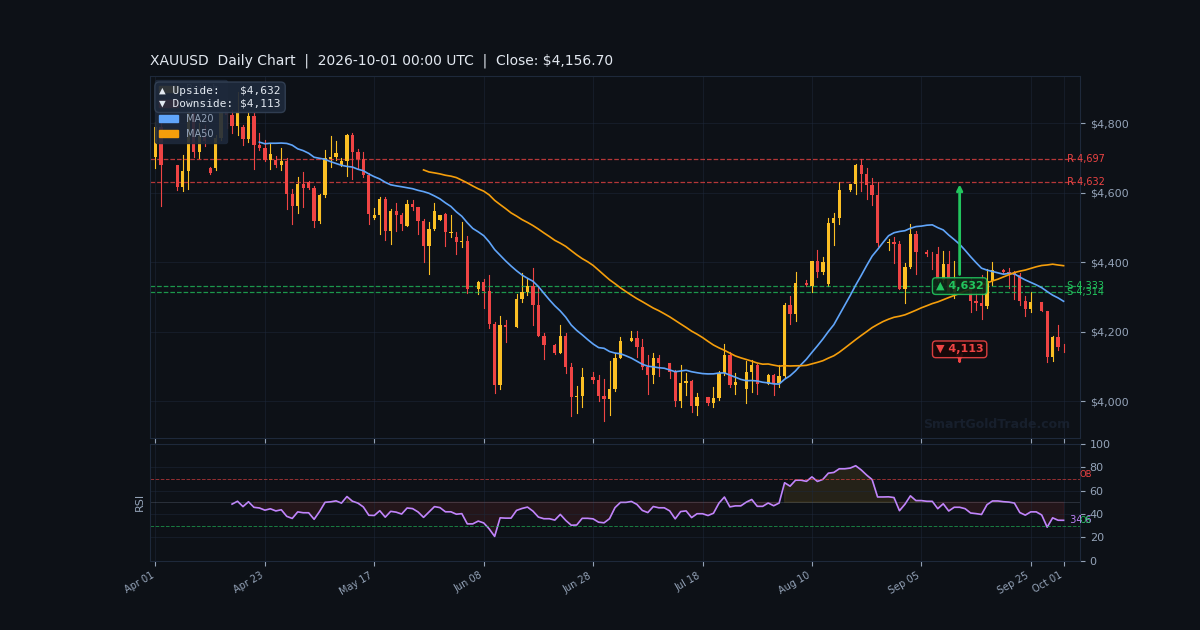
The gold price is trading at $4,160.50 in the Asian session, pinned between a soft PCE print and a hawkish Fed voice that refuses to blink. Wednesday's core PCE came in at 3.0% year-on-year against a 3.3% consensus — a genuine cooling signal. Yet Minneapolis Fed President Neel Kashkari said hours later that inflation near 3% is "still too high" and that he penciled in two more rate increases.
Traders now await Friday's US September employment report for direction. Until then, liquidity is thin and the market is coiled. RSI(14) at 47.4 confirms there is no trend here — only a range. This session is about preparation, not pursuit.
Gold Market Overview
Macro Context
The macro backdrop is genuinely split. The 10-year Treasury yield pushed to 5.298% in the prior session, up roughly 4 basis points, while the 30-year climbed near 5.642%. Higher yields raise the opportunity cost of holding a non-yielding metal — that is the core bearish pressure on gold right now.
Oil is the second lever. US-Iran talks aimed at ending their conflict stalled, and crude moved higher. Independent metals trader Tai Wong put it plainly: energy is moving up, bonds have given up gains, and metals are back under pressure. Higher energy feeds inflation expectations, which keeps the Fed hawkish — a chain that works against gold even when inflation itself is the reason to own it.
The dollar is the third lever. Money markets now price a 61% chance the Fed holds rates steady in October, up from a 60%-plus chance of a hike just a day earlier. That shift should have helped gold. It did not, because Kashkari and Cook both pushed back on the idea that policy is already tight enough.
Session Outlook
Asian session liquidity is thin. The expected hourly range from ATR(14) is just $11.44 — about 0.28% of price. That means moves will look larger than they are, and stop hunts around round numbers are likely.
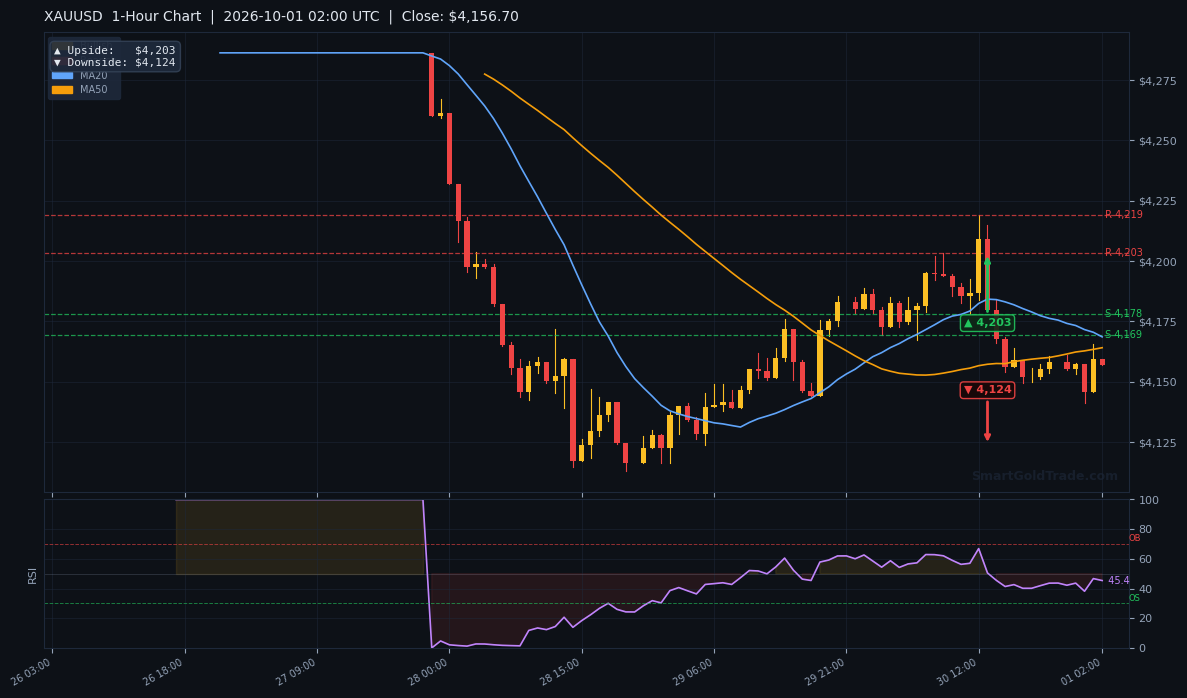
Watch $4,160.50 as the pivot, with $4,203.20 (R1) as the session ceiling and $4,219.00 (R2) beyond it. A clean break of either level on volume would be the first real signal of the day. Without volume, treat every push as noise.
Technical Analysis
Moving Average Structure
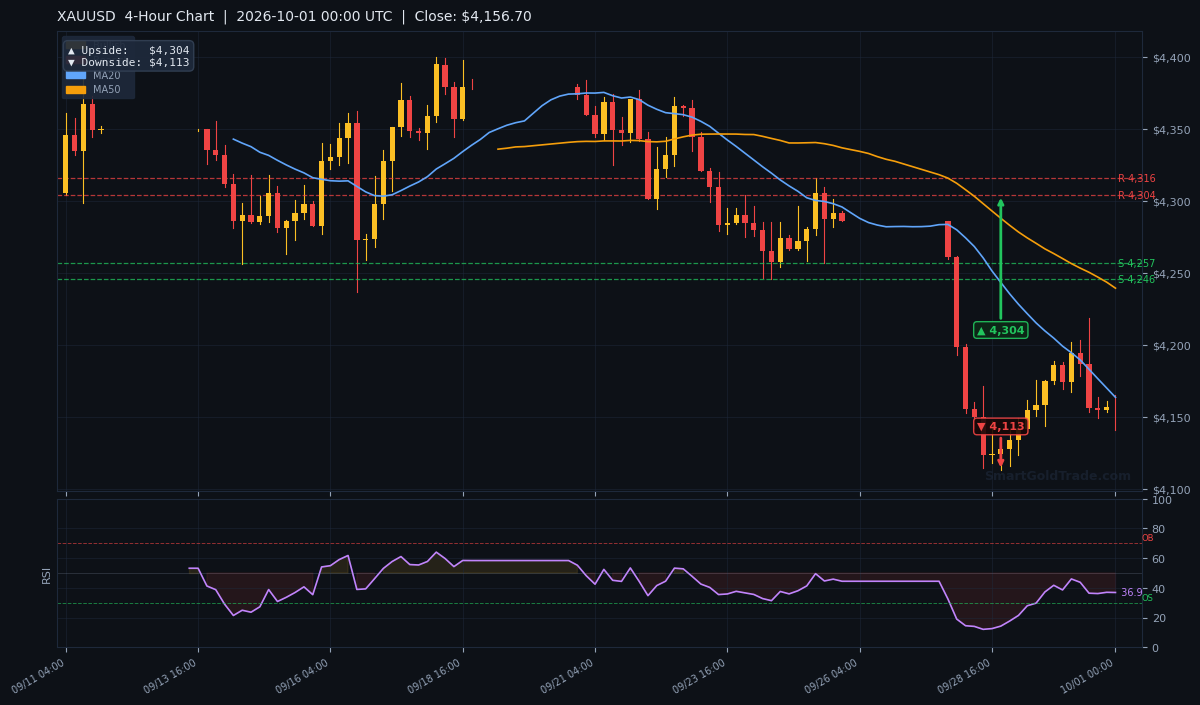
Price sits just below the short-term averages. MA20 is at $4,168.73 and MA50 at $4,164.12. The MA20 sits above the MA50 — a mildly bullish stack — yet price is trading underneath both, which tells you the market is testing whether buyers actually have conviction here.
On the higher timeframes the picture is more cautious. Price has not reclaimed the mid-$4,200s, and until it does, every rally still carries counter-trend risk. The key level to watch on the upside is $4,203.20 (R1) — a close above it would be the first real sign that buyers are back in control.
RSI and Momentum
RSI(14) is at 47.4 — neutral, leaning soft. It is not oversold. That matters, because it means the sellers have room to push further before exhaustion forces a bounce.
Momentum is genuinely two-sided here. The neutral RSI reading says neither side has an edge, and the tight ATR says the market is not yet ready to commit. The read: wait for the break, don't front-run it. Do not short into a quiet range.
Key Price Levels
Immediate resistance sits at $4,203.20 (R1) and $4,219.00 (R2). On the downside, the session pivot is $4,160.50 itself — a break below it opens the door to a deeper test of the $4,140s. The cluster around $4,160–$4,170 is the most important zone of the session.
Volatility is compressed. ATR(14) at $11.44 is only 0.28% of price — the tightest range we have seen this week. That usually precedes an expansion move, but the direction is not yet decided.
| Timeframe | Upside Target | Downside Target |
|---|---|---|
| Daily | $4,219 | $4,140 |
| 4-Hour | $4,203 | $4,140 |
| 1-Hour | $4,203 | $4,140 |
Fundamental Drivers
The dominant driver is Wednesday's PCE report. Headline PCE rose 3.4% year-on-year in August, below the 3.7% consensus. Core PCE rose 3.0%, below the 3.3% expected. On paper, that is dovish — it should have helped gold. It did not, because oil and yields overwhelmed the signal.
Kashkari's comments then reset the narrative. He said the economy remains robust, consumers keep spending, and the longer that continues, the more he questions whether policy is actually tight. He expects one more hike this year and another in 2027. Fed Governor Lisa Cook echoed the concern, saying inflation has stayed too high for too long. Together, these voices kept the hawkish bid under the dollar alive.
Key Event to Watch
Friday's US September employment report is the single most important event on the calendar. A soft NFP would revive rate-cut hopes and give gold room to reclaim $4,203. A hot print would confirm Kashkari's view and open the door to $4,140. Until Friday, expect positioning, not direction.
Devil's Advocate
The bearish case rests on the idea that yields and oil keep rising. But the PCE data already trimmed hike odds, and the market now prices a 61% chance of a hold in October. If Friday's jobs number disappoints, that probability rises fast — and gold's reaction function flips.
The invalidation level for the bearish bias is a clean H1 close above $4,203.20 (R1). That would break the lower-high structure and force a reassessment. A close above $4,219.00 (R2) would confirm a genuine reversal. Until then, rallies are for selling, not chasing.
Trading Strategy for Asian Session
Do not chase. The Asian session is thin, and ATR is only $11.44. Wait for price to reach a defined level before acting.
Short setup: Look for rejection between $4,164 (MA50) and $4,168 (MA20). Stop loss at $4,203 — just above R1. First target $4,140, second target $4,130. That is a clean 1:2 risk-to-reward.
Long setup: Only valid on a confirmed bounce off $4,140 with a bullish reversal candle. Stop loss at $4,128, below the swing low. Target $4,203 (R1) for a 1:3 setup. If $4,130 breaks, stand aside — the daily downside target of $4,140 is then in play.
Position size should reflect the thin liquidity. Half-size is sensible until London opens. For those who prefer a hands-off route, copy trading lets you mirror established gold traders through the same range without staring at the chart. If you use automated execution, a news event trading protection tool can pause entries around Friday's NFP release — a useful guardrail when the calendar turns hot.
If you're looking to own metal outright rather than trade the chart, purchase physical gold through SmartGoldTrade's certified store. And for those building longer-term wealth without leverage, Shariah-compliant gold investment pools offer a profit-sharing route that sidesteps the noise entirely.
Key Takeaways
- Gold price at $4,160.50, below MA20 ($4,168.73) and MA50 ($4,164.12) — but the MA20/MA50 stack remains bullish.
- RSI at 47.4 is neutral — no side has an edge, and ATR at $11.44 says the range is tight.
- Resistance at $4,203.20 (R1) and $4,219.00 (R2) caps any bounce.
- ATR of $11.44 means the expected session range is tight — expect noise, not trend.
- Friday's US employment report is the week's decisive catalyst for the gold price.
Conclusion
The gold price bias for this Asian session is mildly bearish on price position, but the conviction is low. Price is below both the MA20 and MA50, and the market is coiled inside a tight $11 range. That is the case for sellers.
The counterweight is the MA20 sitting above the MA50 — a bullish stack — plus the PCE data, which already cooled rate-hike expectations. That combination argues against aggressive shorting into the lows.
The level that matters is $4,203.20. Hold below it, and gold grinds sideways between $4,160 and $4,203 into Friday. Break it, and $4,219.00 becomes the next stop. Trade the reaction, not the prediction.
FAQ
What is the gold price right now?
The gold price is $4,160.50 in the Asian session, trading between MA20 at $4,168.73 and MA50 at $4,164.12.
Is $4,140 support strong enough to hold?
It is the first real test. A clean break below the pivot targets the $4,140 zone, while a hold opens the door back toward $4,203.20 (R1).
Why is gold falling when PCE inflation came in soft?
Because rising Treasury yields — 10-year at 5.298% — and higher oil prices are outweighing the softer inflation print. Kashkari's hawkish comments reinforced the pressure.
What is the key resistance level for gold today?
$4,203.20 (R1) is the first hurdle, followed by $4,219.00 (R2). A close above R1 would invalidate the bearish bias.
What event could change the gold price trend this week?
Friday's US September employment report. A weak number would revive rate-cut hopes and push gold toward $4,203. A strong number would open $4,140.
Risk disclaimer: This analysis is for informational purposes only and does not constitute investment advice. Gold trading carries significant risk of loss. Past performance is not indicative of future results. Always conduct your own research and consult a licensed financial advisor before making any trading decisions.