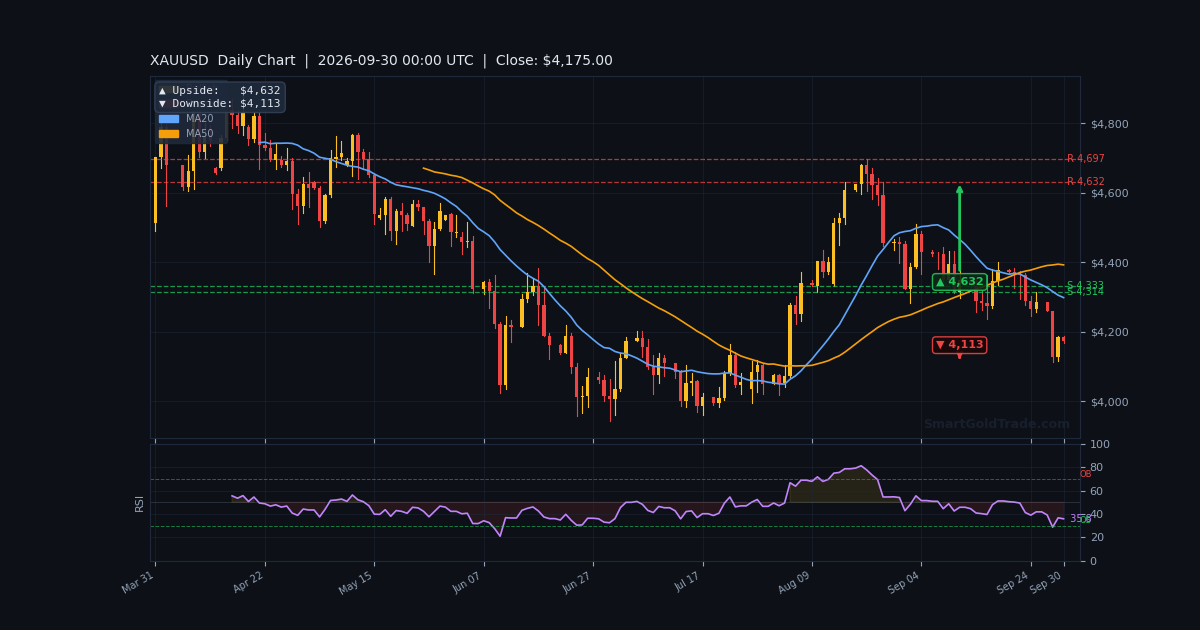
The gold price is holding near $4,172.44 in early Asian trade on September 30, 2026, steadying after last week's slide to an eight-week low. The recovery follows Tuesday's move that pushed XAU/USD down toward the $4,113 area before buyers stepped back in.
That bounce came as traders digested Australia's August CPI print of 4.0% year-over-year, which matched forecasts but kept global inflation worries alive. Meanwhile, the US Dollar Index pressed to a fresh high not seen since late July, capping gold's upside.
With liquidity thin and no major US data due until the PCE release later today, this Asian session looks likely to stay range-bound. Preparation matters more than prediction right now.
Gold Market Overview
Macro Context
The macro backdrop remains tilted against gold in the near term. The US 30-Year Treasury yield pushed past 5.61% on Tuesday, a level last touched in 2002, while the 2-year yield settled near 4.88%. Higher long-end yields raise the opportunity cost of holding a non-yielding asset.
A firmer dollar has compounded the pressure. DXY climbed to its highest since July 28 as markets priced in another Fed rate hike for October. Oil-driven inflation fears are reinforcing that hawkish bias, even as gold's traditional role as an inflation hedge struggles against tighter policy expectations.
Geopolitical risk remains a background factor, but it is not currently strong enough to override the rates and dollar story. That keeps the short-term bias cautious.
Session Outlook
Asian session liquidity is thin, and that means moves can look larger than they really are. With ATR(14) at $13.91, the expected hourly range is roughly 0.33% of price — modest by recent standards.
Expect choppy conditions between $4,144 and $4,185 unless a headline forces a break. The daily open at $4,183.63 sits just above current price, and VWAP at $4,177.89 is the near-term pivot.
Traders should avoid chasing moves in this environment. Low-volume breakouts often reverse once London arrives.
Technical Analysis
Moving Average Structure
The moving average picture is bearish. Price at $4,172.44 is trading below the EMA200 at $4,256.29, which confirms the broader downtrend on the H1 chart. The EMA20 at $4,163.47 sits just below price, offering thin short-term support, while the EMA50 at $4,174.81 is pressing down from above.
That EMA20/EMA50 cluster between $4,163 and $4,175 is the immediate battleground. A sustained break below EMA20 opens the door to $4,144, while reclaiming EMA50 would ease immediate selling pressure.
On the higher timeframes, the H4 EMA200 at $4,324.11 and the D1 EMA200 at $4,314.72 both sit far above price, reinforcing that any bounce is counter-trend until proven otherwise.
RSI and Momentum
RSI(14) reads 54.9, squarely in neutral territory. That is notable because it shows neither overbought nor oversold conditions — the market has room to move in either direction without a technical trigger.
Stochastic at 78.9/85.2 is approaching overbought, while MACD at 6.01 with a positive histogram of 3.78 suggests short-term momentum has turned mildly constructive. ADX at 24.5 confirms a weak, ranging market rather than a trending one.
For traders, this combination argues against aggressive directional bets. Range tactics fit better than breakout tactics right now.
Key Price Levels
Support rests at S1 $4,142.34 and S2 $4,110.87. Resistance is stacked at R1 $4,288.56 and R2 $4,295.90, both well above current price and unlikely to be tested this session.
Session marks matter here: the prior day high at $4,185.39 and prior day low at $4,113.49 frame the recent range. The weekly open at $4,272.44 shows how far price has fallen this week — down 2.34%.
Bollinger bands at $4,190.27 (upper), $4,159.19 (middle), and $4,128.11 (lower) give a clean envelope for the session.
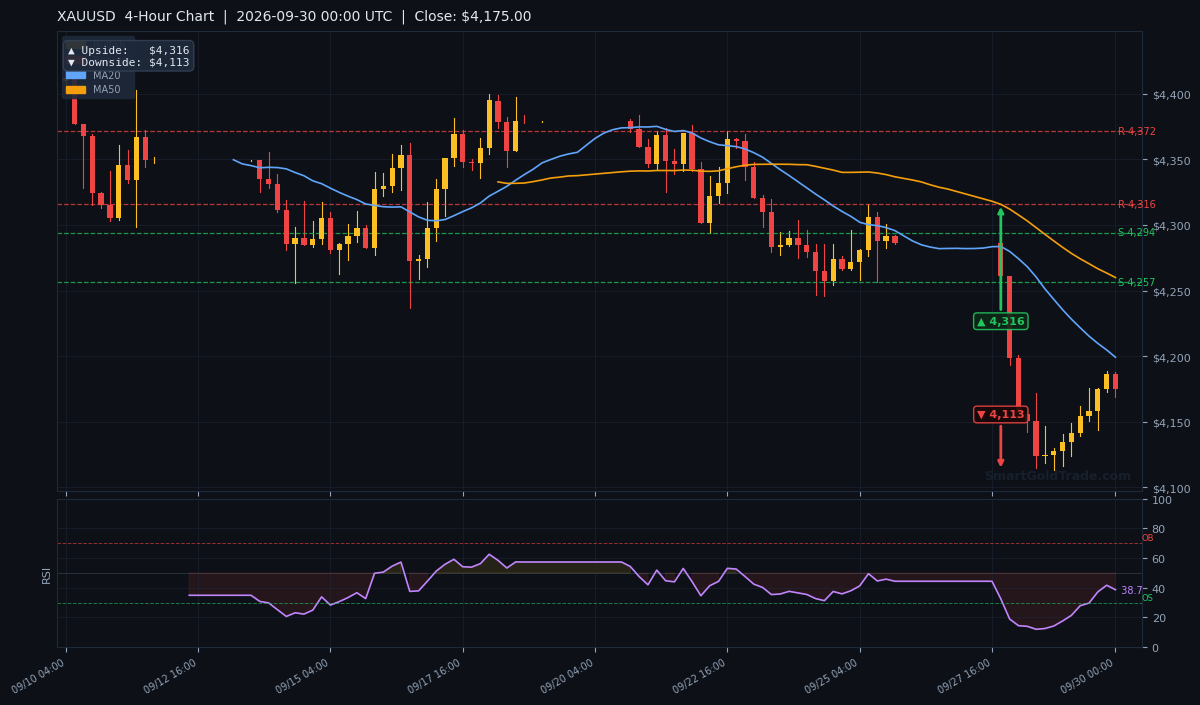
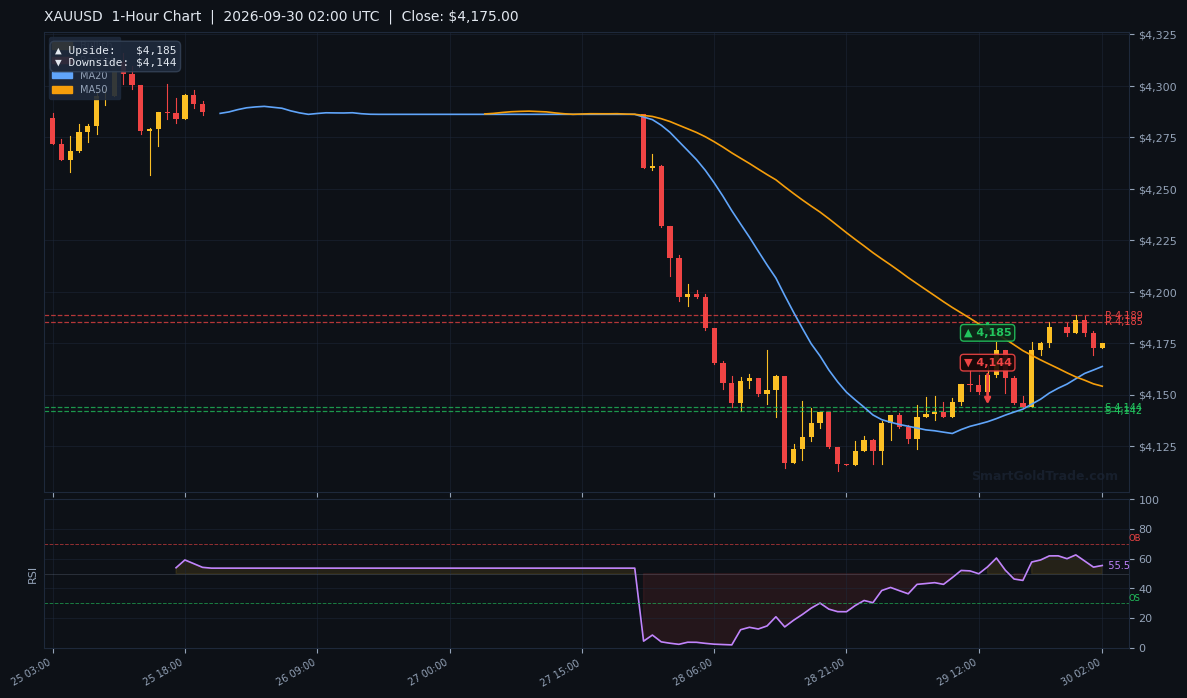
| Timeframe | Upside Target | Downside Target |
|---|---|---|
| Daily | $4,632 | $4,113 |
| 4-Hour | $4,316 | $4,113 |
| 1-Hour | $4,185 | $4,144 |
Fundamental Drivers
Two events dominate the near-term narrative. First, Australia's August CPI came in at 4.0% year-over-year, up from 3.5% in July and in line with forecasts. The monthly print rose 0.4%, while the Trimmed Mean advanced 3.6% annually. The data did little to shift the broader inflation narrative but kept the pressure on central banks globally.
Second, oil's recent rally has reinforced inflation concerns and expectations for further Fed tightening. Strategists at OCBC noted that gold's break below $4,200 likely triggered technical selling, and that oil plus the rates response remain the key swing factors for the metal.
Key Event to Watch
The single most important catalyst this week is today's US August PCE Price Index, the Fed's preferred inflation gauge. It arrives alongside the final Q2 GDP report. A soft core PCE print could cool rate-hike bets, weaken the dollar, and give gold room to recover toward $4,185 and beyond.
A hot print would do the opposite — reinforcing October hike odds and pressuring gold toward $4,144. Friday's Nonfarm Payrolls report is the second key event, and any sign of labor market weakness could shift the Fed narrative quickly.
Devil's Advocate
The bearish case has real cracks. RSI at 54.9 is not oversold, but it is also not confirming fresh downside momentum, and MACD's positive histogram suggests sellers are losing steam. If today's PCE comes in soft, the dollar could retreat sharply from its July highs.
The key reversal level to watch is $4,185, the prior day high and the 1-hour upside target. A clean close above that level would invalidate the immediate bearish bias and open a path toward $4,256.
Conversely, a decisive break below S1 $4,142.34 would flip the trade the other way, targeting S2 $4,110.87 and the prior day low at $4,113.49.
Trading Strategy for Asian Session
Given the ranging conditions and thin liquidity, the cleanest approach is to trade the edges of the current envelope rather than the middle. The EMA20/EMA50 cluster between $4,163.47 and $4,174.81 is the decision zone.
For a long setup, consider an entry on a hold above $4,175 with a stop below $4,160 — roughly one ATR of risk at $13.91. First target sits at $4,185, the 1-hour upside level and prior day high. A secondary target is $4,190, the upper Bollinger band.
For a short setup, an entry below $4,163 with a stop above $4,178 targets $4,144, the 1-hour downside level. A deeper move toward S1 $4,142.34 would confirm the bearish continuation.
Position sizing should reflect the low-liquidity environment. Avoid breakouts that occur on thin volume before London opens, and consider using a news event trading protection tool to guard against PCE-related volatility later today.
For traders seeking a longer-term, interest-free approach to the metal, halal gold trading offers physical ownership by the gram without leverage or CFDs.
Key Takeaways
- Gold price holds $4,172.44 after an eight-week low, with price still below the H1 EMA200 at $4,256.29.
- RSI(14) at 54.9 is neutral, and ADX at 24.5 confirms a weak, ranging market — not a trending one.
- Immediate resistance sits at $4,185; immediate support at S1 $4,142.34 and S2 $4,110.87.
- Today's US PCE Price Index is the key catalyst — a soft print could lift gold toward $4,185, a hot print could push it to $4,144.
- Weekly performance is down 2.34% from the open at $4,272.44, reflecting persistent dollar and yield pressure.
- Expected session range is roughly $13.91 based on ATR(14) — thin liquidity favors range tactics over breakout chasing.
Conclusion
The gold price is caught between a firm dollar and a market waiting for the PCE print. Price at $4,172.44 sits below the H1 EMA200, keeping the short-term bias bearish, but neutral RSI and a positive MACD histogram argue against aggressive selling.
The level that matters most this session is $4,144. A clean break below it opens S1 $4,142.34 and then $4,113. A hold above $4,175 shifts focus to $4,185 and possibly $4,190.
With PCE due later today and NFP on Friday, patience is the edge. Let the data speak before committing size.
Frequently Asked Questions
- What is the gold price today?
- The gold price is $4,172.44 per ounce as of the Asian session on September 30, 2026, trading below the H1 EMA200 at $4,256.29.
- Why is gold going down this week?
- Gold has fallen 2.34% from the weekly open at $4,272.44, pressured by a stronger dollar, rising Treasury yields, and oil-driven inflation fears that reinforce Fed rate-hike expectations.
- What are the key support levels for gold right now?
- Immediate support sits at S1 $4,142.34, followed by S2 $4,110.87 and the prior day low at $4,113.49.
- What could push gold back above $4,200?
- A soft US PCE print today would weaken the dollar and could lift gold through $4,185 toward the H1 EMA200 at $4,256.29. A break above $4,185 is the first signal.
- Is now a good time to buy gold?
- With RSI at 54.9 and price below the EMA200, the trend is still bearish. A confirmed hold above $4,175 would offer a better risk-reward entry than buying into current weakness.
Risk Disclaimer: Trading Gold (XAU/USD) carries significant risk of loss and is not suitable for all investors. This content is for informational purposes only and does not constitute financial advice. Always conduct your own research and trade responsibly.