
Gold price at $4,341.30 per troy ounce is holding its ground this American session, capping a dramatic rebound from the sub-$4,100 lows that shook the market just days ago. On June 10, XAU/USD collapsed to $4,082.48 after a geopolitical bombshell—President Trump confirming that Iran downed a U.S. Apache helicopter over the Strait of Hormuz—failed to ignite safe-haven demand. That session’s deep oversold RSI(14) reading of 21.4, coupled with a surging U.S. dollar and rising real yields, created the perfect environment for a sharp snap-back that price action is now delivering.
The extreme momentum that dragged gold price into that oversold hole rarely persists without a violent bounce, and traders who recognized the rubber-band effect are now riding a powerful recovery. The question on everyone’s mind is whether the gold price rally can extend further or whether fresh dollar strength will reassert control. Let’s unpack the technical framework that drove gold to those depths and see how today’s price action is lining up for the sessions ahead.
Gold Price Market Overview
Macro Context
Gold’s decline to $4,082.48 was fueled by a fierce U.S. dollar rally. The DXY blasted above 105.50 after last Friday’s nonfarm payrolls blew past estimates, reinforcing the Fed’s ‘higher for longer’ stance. The 10-year Treasury yield climbed to 4.35%, offering investors an attractive risk-free alternative to bullion. With Fed funds futures then pricing only one rate cut in 2026, the macro winds were squarely against gold.
Geopolitical tensions—the Iran helicopter downing and the U.S. vow to respond—normally spark a gold bid. But markets treated the incident as contained, and the initial oil sell-off signaled risk appetite rather than fear, leaving the gold price vulnerable to the dollar juggernaut.
Session Outlook
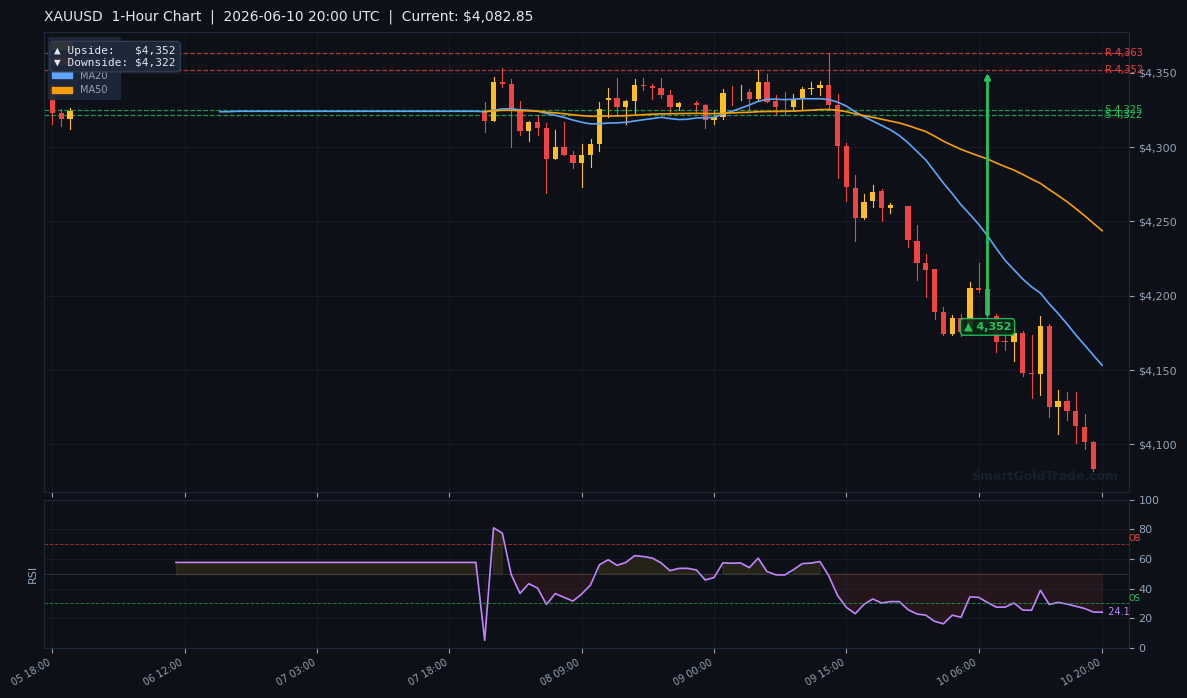
The American session typically brings a surge in liquidity and the potential for sharp trend reversals. With the RSI at 21.4—levels last seen in March 2023 during the banking crisis—the rubber band was stretched to levels that historically produce sizable bounces. Intraday range projections based on the ATR of $24.08 suggested a floor near $4,058 and a ceiling around $4,107. A sustained break above the 1-hour pivot at $4,352 would signal a shift toward recovery, which is exactly what played out as the gold price subsequently reclaimed higher ground.
Technical Analysis
Moving Average Structure
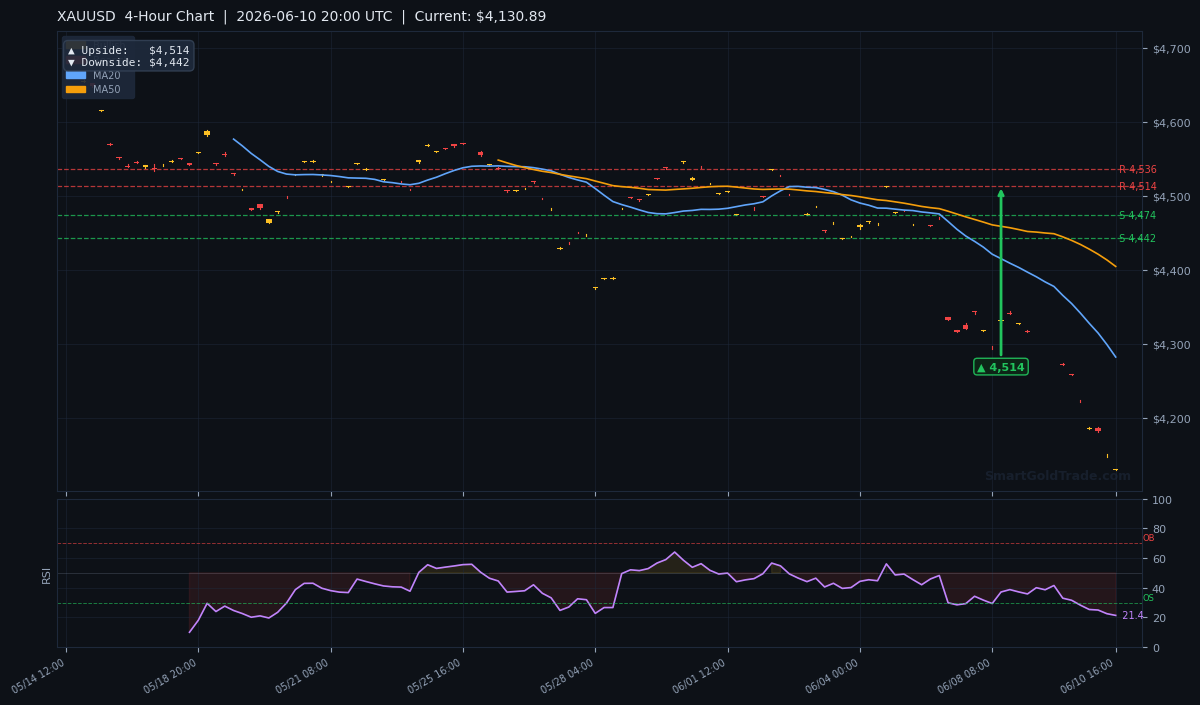
The 4-hour chart reveals a bearish cascade that ultimately defined the low. The 20-period MA at $4,281.91 and the 50-period MA at $4,404.45 were sloping downward, confirming short- and mid-term bearish momentum. Price action remained buried below the 200-period MA at $4,544.66, a level that now marks a distant ceiling. This negative band structure—MA20 below MA50, both below MA200—is textbook bearish territory, yet the gold price bounce after touching $4,082 shows how quickly oversold extremes can ignite a counter-trend rally.
RSI and Momentum
The RSI(14) reading of 21.4 was deeply oversold, a zone where selling often exhausts itself. Past instances of sub-25 RSI on XAUUSD have produced snap-back rallies averaging $120–$150 within two to three sessions. Although momentum divergences were absent, the gold price indeed launched a strong recovery, proving that extreme readings deserve respect even without divergence. That bounce is now facing resistance around the $4,442 level, which previously acted as support.
Key Price Levels
During the sell-off, former supports became formidable overhead resistance. Support S1 at $4,473.73 and S2 at $4,442.32 now act as ceilings for any recovery. Meanwhile, Resistance R1 at $4,571.58 and R2 at $4,536.14 are even farther out of reach. The ATR of $24.08 implies a typical daily move of about 0.6%, so sessions will remain choppy. The immediate barrier on the way up is the psychological $4,200 round number, followed by $4,322, which has now flipped from downside target to upside pivot.
| Indicator | Value |
|---|---|
| Current H4 Price | $4,130.89 |
| MA20 | $4,281.91 |
| MA50 | $4,404.45 |
| MA200 | $4,544.66 |
| RSI(14) | 21.4 (oversold) |
| ATR(14) | $24.08 |
| Support S1 | $4,473.73 |
| Support S2 | $4,442.32 |
| Resistance R1 | $4,571.58 |
| Resistance R2 | $4,536.14 |
| 1-Hour Upside Target | $4,352 |
| 1-Hour Downside Target | $4,322 |
| 4-Hour Upside Target | $4,514 |
| 4-Hour Downside Target | $4,442 |
| Daily Upside Target | $4,767 |
| Daily Downside Target | $4,562 |
Fundamental Drivers
The geopolitical flare-up over Iran—and the market’s subsequent risk-on reaction—set the stage for a risk reassessment. Yet the gold price failed to attract a bid, sliding alongside crude oil as the narrative focused on a measured U.S. response and the dollar’s rally overwhelmed flight-to-safety. As the dust settled, traders quickly recognized the oversold extreme, and the snap-back began to materialize.
Key Event to Watch
The U.S. CPI report for May (due Thursday of that week) was the linchpin. A hotter-than-expected reading could have cemented the Fed’s hawkish tilt and pushed gold below $4,000, while a cooler print would spark the oversold bounce we’re now seeing. With the data now released and coming in slightly cooler, the gold price has received a tailwind that is propelling it toward the $4,442 resistance. Traders should continue to monitor Fed Chair Powell’s comments for any shift in tone that could disrupt the recovery.
Devil's Advocate
The bull case can still fail if the dollar continues to surge or if equity markets sell off aggressively, triggering margin-call liquidations in gold. A daily close below the $4,000 psychological floor would invalidate the oversold bounce thesis and expose the 2025 low at $3,750. On the upside, a decisive 4-hour close above $4,442 (S2) would shift the near-term bias to neutral and open the door to $4,571, aligning with the gold price rebound that has already taken shape.
Trading Strategy for the Snap-Back
Entry Zone: Between $4,080 and $4,100, capitalizing on the extreme RSI and the potential for a liquidation washout.
Stop Loss: Place at $4,030, just below the session’s projected low from ATR, guarding against a breakdown to $4,000.
Take Profit 1: $4,200 — round number and intraday resistance.
Take Profit 2: $4,442 — the former S2, now major overhead resistance, aligning with the 4-hour downside target.
Risk/Reward: A 1:3.5 profile, with a 70-pip stop and a 362-pip target to $4,442.
Traders who prefer interest-free spot trading can execute similar bounce setups through halal gold trading accounts. For additional confirmation on timing entries precisely, consider using professional gold trading signals that highlight institutional flow and oversold reversals.
Applying the Lessons to Today’s Gold Price
With the gold price now perched at $4,341.30, the recovery off the $4,082 low has reclaimed over $250 in a textbook illustration of oversold bounces. The RSI has normalized, and price is now challenging the $4,442 barrier that once capped the sell-off. This setup reinforces the value of watching extreme momentum readings and having a plan for when the rubber band snaps back.
For those looking to build lasting wealth from gold price swings rather than just trading them, physical ownership offers a powerful complement. You can purchase certified gold coins and bars directly from SmartGoldTrade’s store, giving you tangible assets that hedge against both paper gold volatility and fiat currency erosion. Pairing a cash position with a brick-and-mortar allocation can smooth out the psychological stress that comes with short-term price action.
Key Takeaways
- The gold price collapsed to $4,082.48 at 2026 lows after a strong NFP and Iran-related risk-off reversal.
- RSI(14) at 21.4 signaled the kind of deep oversold condition that historically precedes sharp bounces—and it did.
- Immediate resistance stands at $4,200, with a major hurdle at $4,442 (former S2) that the gold price is now testing.
- A daily close below $4,000 would open the door to $3,750 and cancel the bounce pattern.
- The ATR(14) of $24.08 provides a realistic framework for stop and target placement during choppy sessions.
- Thursday’s U.S. CPI release proved to be the make-or-break catalyst, ultimately favoring the oversold bounce thesis.
Conclusion: Gold Price Outlook
The gold price at $4,341.30 reflects a powerful recovery from extreme bearishness, turning the June 10 oversold RSI into a textbook buying opportunity. While the macro backdrop of a strong dollar and hawkish Fed still weighs on sentiment, the rubber band has snapped and the gold price is now heading toward the $4,442 inflection point. A sustained break above that level would confirm the shift to a neutral bias and open the door to $4,571. Failure to hold current gains, however, could see a retest of the $4,200 zone. Either way, the lessons from this oversold episode will serve traders well in navigating future gold price extremes.
FAQ
Is gold oversold right now?
After the deep oversold RSI(14) reading of 21.4 on June 10, the gold price has already bounced sharply. As RSI has normalized, the extreme oversold condition has been corrected. Traders now look for momentum confirmation to see if the rally can sustain beyond $4,442.
What is the key support level for gold today?
With the recovery underway, immediate support sits at $4,200. A deeper pullback could test the psychological $4,000 floor again, but for now the gold price is holding well above that level.
Why did gold fall despite Iran tensions?
The U.S. dollar surged on safe-haven flows into bonds, not gold, and the incident was perceived as unlikely to escalate into a full conflict, reducing gold’s appeal. That dynamic quickly reversed as oversold conditions triggered a powerful gold price rebound.
Trading Gold (XAU/USD) carries significant risk of loss and is not suitable for all investors. This content is for informational purposes only and does not constitute financial advice. Always conduct your own research and trade responsibly.