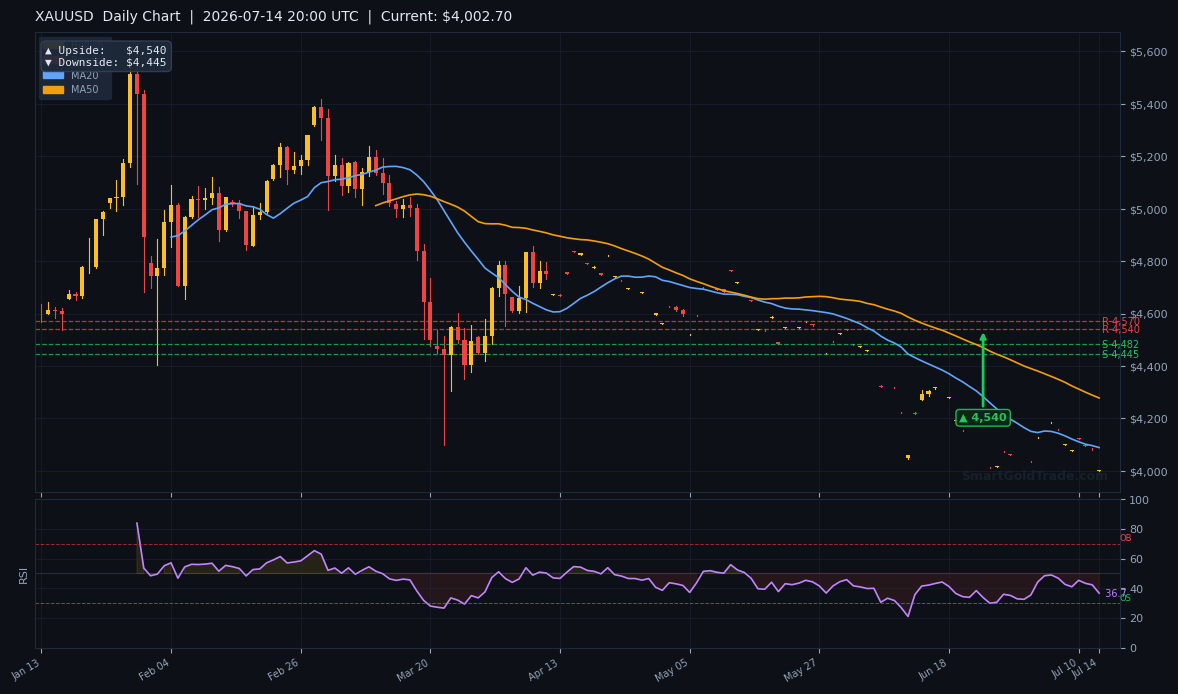
The gold price sits at $4,053.09 this American session, still nursing wounds from a breakdown below every major moving average.
Last week's ISM services report kept the dollar bid and yields stubborn, reminding traders that the Fed's higher-for-longer narrative has teeth.
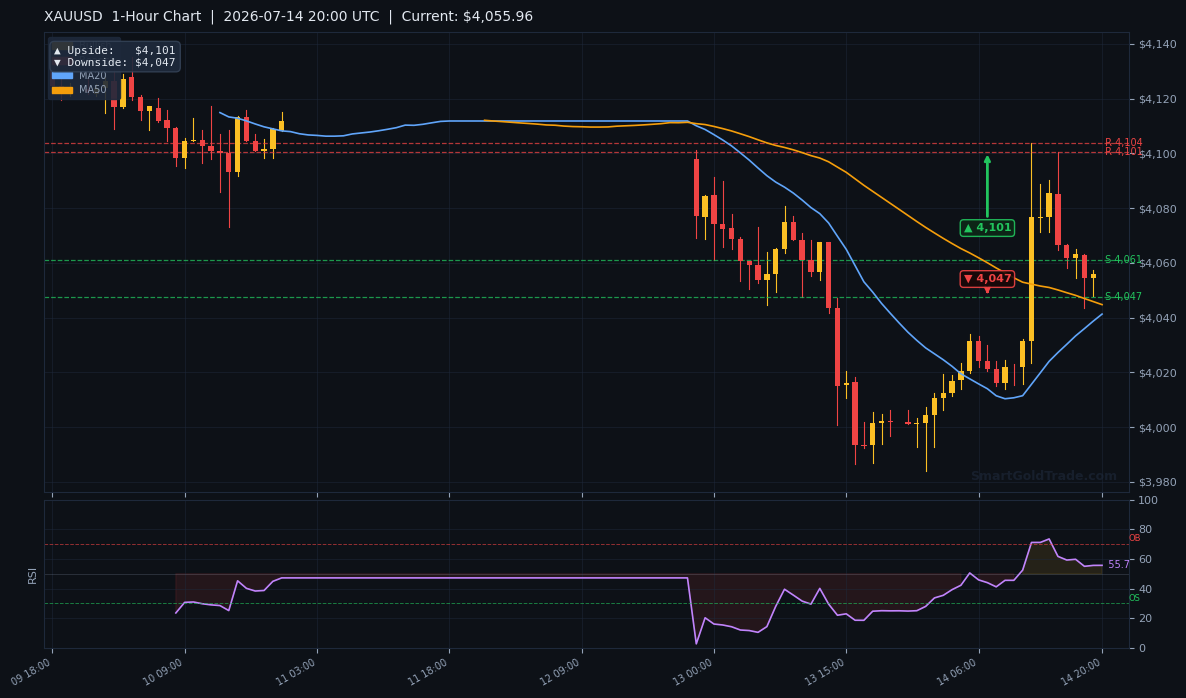
The charts are now flashing a structure that rarely rewards dip-buyers — and the 1-hour timeframe points directly toward $4,047 as the next downside magnet.
Gold Price Today: Market Overview
Macro Context
The US Dollar Index is hovering near multi-week highs, while the 10-year Treasury yield holds above 4.4%, sapping any safe-haven bid from gold.
Earlier this month, Bank Negara Malaysia kept its overnight policy rate at 2.75% for the sixth consecutive meeting, citing cautious global growth and contained inflation — a reminder that central banks outside the US are also in a holding pattern, limiting upside catalysts for non-yielding assets.
From an Islamic finance perspective, gold’s non-yielding nature is actually a virtue — it avoids riba by definition — but in the current environment that same characteristic makes it less competitive when yield-bearing alternatives are paying real returns. Even the Shariah-conscious investor is watching the dollar and Fed rhetoric closely.
With no immediate geopolitical shock on the radar, the gold price is forced to trade purely on rate differentials, and right now, that equation favors the bears.
Session Outlook
The American session typically brings a surge in liquidity and sharper directional moves as New York desks digest the morning's economic data.
Today, thin volume is likely to amplify technical levels; with gold already trading below the intraday pivot at $4,060, bears will be eyeing a direct run toward the $4,047 target printed on the 1-hour chart.
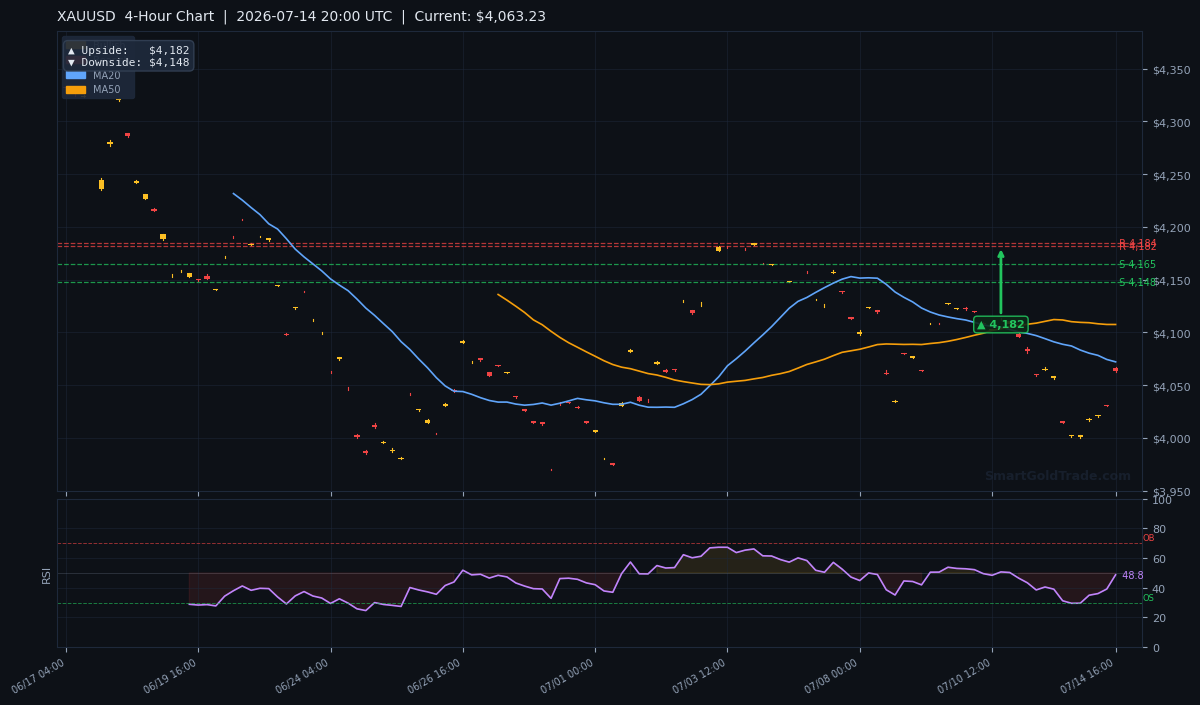
On the flip side, any bounce that fails to reclaim $4,148 — the 4-hour pivot — is likely to be faded by momentum traders.
Technical Analysis
Moving Average Structure
The moving averages tell a brutally simple story.
The 20-period simple moving average on the H4 chart is $4,072.11, the 50-period SMA rests at $4,107.53, and the 200-period SMA looms far above at $4,205.66.
With the current gold price of $4,053.09 sitting below all three, the short-term, medium-term, and long-term structure is bearish — and the EMA cross of MA20 below MA50 confirms that downward pressure is accelerating.
On the 1-hour chart a bearish pennant reinforces the downside bias, with a measured move that lands squarely at $4,047 — the same level the pivot indicator flags.
RSI and Momentum
The 14-period Relative Strength Index reads 48.8, squarely in neutral territory.
That is the most dangerous part of this setup: because the RSI is not oversold, there is no exhaustion signal to suggest a meaningful bounce is imminent.
Price can continue to drift lower for several sessions before hitting extreme levels that normally attract buyers.
Key Price Levels
Support levels derived from the indicator framework show S1 at $4,164.51 and S2 at $4,147.61, but price has already sliced through both, turning them into resistance.
On the upside, R1 at $4,184.32 and R2 at $4,181.55 form a tight resistance band that bulls must conquer to change the narrative.
The ATR(14) sits at $15.28, meaning the expected daily range from the current $4,053.09 spans roughly $4,037.81 to $4,068.37 — leaving the 1-hour pivot downside target of $4,047 comfortably inside that band.
Fundamental Drivers
The macro backdrop remains unsupportive for gold, with real yields creeping higher and the Federal Reserve signaling no urgency to cut rates before the September meeting at the earliest.
Last week's services data underscored the US economy's resilience, reinforcing the dollar's appeal and pushing institutional funds toward risk-on assets instead of bullion.
Commerzbank's Dr. Henry Hao and Moses Lim noted this cautious global tone earlier this month, pointing to BNM's steady rate decision as a mirror of broader central bank hesitation — an environment where gold struggles to find fresh inflows.
Meanwhile, market attention is shifting toward the July Consumer Price Index due at month-end; a softer reading could revive bets on a September rate cut and offer the gold price some relief.
Key Event to Watch
Traders should keep an eye on Thursday's US retail sales report, the most significant tier-one data release remaining this week.
A strong consumption reading would likely propel DXY above recent highs and send the gold price toward $4,047 with speed; a miss, however, could trigger a temporary rebound to the $4,148 resistance.
Devil's Advocate
The bearish thesis collapses if the gold price manages to reclaim and close above $4,184.32 on a daily timeframe.
That level, the R1 resistance, would flip the moving averages into a potential bottoming structure and force short-sellers to cover rapidly.
Beyond the charts, physical demand from key Asian markets tends to surge when the gold price approaches the $4,000–$4,100 region, as recent import numbers from China and India have shown. That latent buying interest could put a floor under any selloff and force a short-squeeze if the dollar rally stalls.
Additionally, a sudden geopolitical shock — such as a new sanctions headline or conflict escalation — could invalidate the technical breakdown entirely and push gold back toward the $4,540 daily upside target.
Trading Strategy for American Session
The clearest opportunity lies in joining the bearish momentum on a pullback to former support.
I am eyeing a short entry zone between $4,145 and $4,150, which corresponds to the broken S2 support area that should now act as ceiling.
A stop-loss order above $4,184 — just beyond R1 — keeps risk controlled at roughly 2.2× ATR, ensuring enough breathing room without exposing the account to a full-scale reversal.
The primary take-profit target sits at $4,047, the 1-hour pivot downside level, while a more conservative partial-profit level can be placed at $4,070 near the session's lower volatility band.
For traders who prefer confirmation, waiting for an hourly close below $4,060 provides a smaller entry window but with higher probability.
Those executing this plan can enhance precision with professional gold trading signals that align with institutional order flow.
Key Takeaways
- Gold price sits at $4,053.09, below all three key moving averages — a bearish structural signal.
- RSI at 48.8 is neutral, meaning no oversold bounce is reliable, and downside momentum can persist.
- The 1-hour chart pivot arrow targets $4,047 as the next downside level, aligned with the daily ATR range.
- Resistance is stacked at $4,148 and $4,184; any rally that fails to clear these levels is a selling opportunity.
- Thursday's US retail sales data could act as the catalyst that pushes the gold price to the $4,047 target.
- A daily close above $4,184 invalidates the bearish premise and opens the door to the daily upside of $4,540.
Conclusion
The gold price continues to trade under heavy pressure with no reliable technical floor until the $4,047 zone.
Until the moving average structure repairs itself or the RSI reaches oversold extremes, bears have the edge — especially during the liquidity-rich American session.
Short-term traders should be prepared for a test of the 1-hour downside target, while long-term investors may view a dip toward $4,047 as a chance to purchase physical gold coins and bars at a lower basis. In a bearish tape like this, having the ability to trade spot gold on a halal, zero-interest basis ensures that you're not paying swap fees or borrowing costs, so your portfolio stays fully Shariah-compliant even as you react to short-term price swings.
FAQ
- What is the gold price outlook for today's American session?
- The gold price is expected to face continued bearish pressure, with a high probability of testing the $4,047 support level before any meaningful bounce.
- Where are the key support and resistance levels right now?
- Immediate resistance sits at $4,148 and $4,184, while the next major support is the 1-hour downside target of $4,047. A break below that opens the door to the daily target of $4,445.
- Is now a good time to buy gold?
- For short-term traders, the setup favors selling into strength until the gold price reclaims $4,184. Long-term investors who want to trade spot gold without leverage may consider accumulating near $4,047 for a potential rebound.
Risk Disclaimer: Trading Gold (XAU/USD) carries significant risk of loss and is not suitable for all investors. This content is for informational purposes only and does not constitute financial advice. Always conduct your own research and trade responsibly.