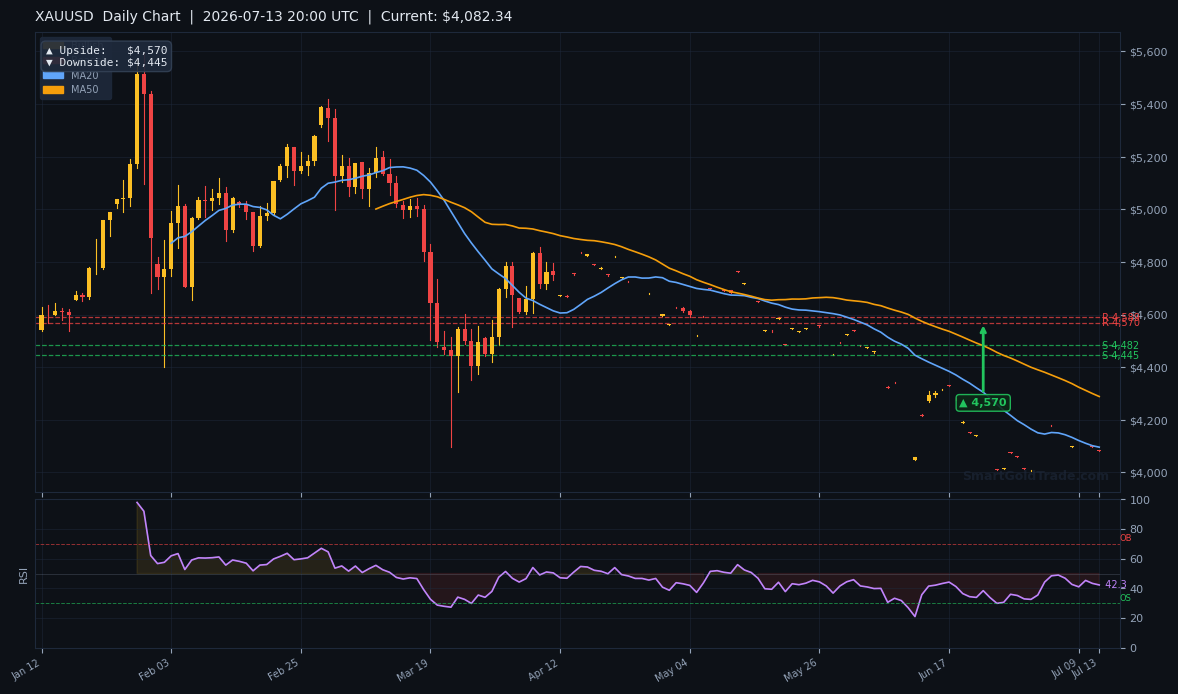
Gold price is trading at $3,999.88 as the American session gets underway, hovering right around the psychological $4,000 level after a sharp rejection from moving averages last week. The breakdown below $4,147—formerly key support—has opened the door to deeper losses, but momentum has stalled.
This week, traders will watch the U.S. CPI release and Warsh testimony, but the immediate opportunity sits in a potential bounce in the gold price from $4,000 that could deliver a rapid $70 move. The interest-free spot gold trading platform is seeing elevated demand as volatility spikes.
Gold Market Overview
Macro Context
The U.S. Dollar Index (DXY) is holding firm above 105.50, keeping pressure on the yellow metal. 10-year Treasury yields are trading near 4.25%, while Fed funds futures price in no rate cut until at least September. This backdrop has been inhospitable for non-yielding assets, and the gold price's slide below the 20-day and 50-day moving averages confirms the bearish pulse.
However, rising geopolitical risk—especially around the Strait of Hormuz—is tempering selling aggression and providing a safety bid near round-number support. The gold price is therefore wedged between macro headwinds and haven demand.
Session Outlook
The American session typically brings a surge in liquidity as New York desks and algorithmic funds overlap with European traders. Given the steep decline already priced in, the gold price could favor a reversal attempt if $4,000 holds.
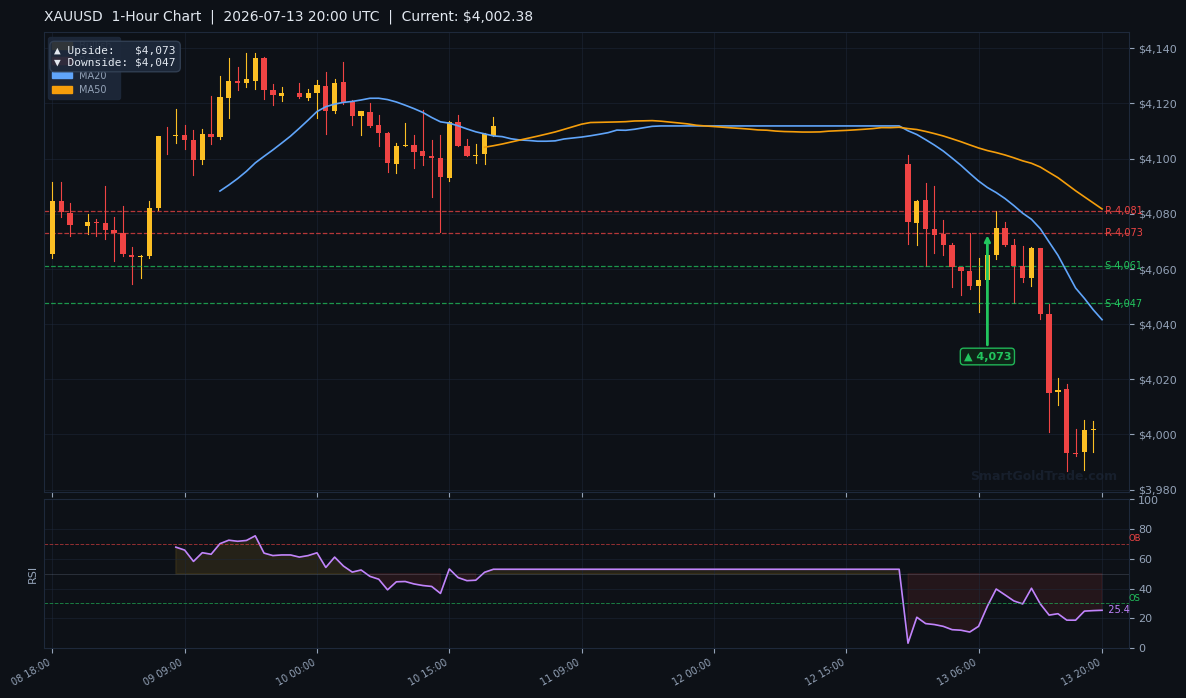
Expect initial range-bound action before a potential test of either $3,980 or a push back toward $4,047—the 1-hour pivot. A surprise hawkish comment from a Fed speaker after the close could extend losses, but the immediate bias is for a technical bounce.
Technical Analysis
Moving Average Structure
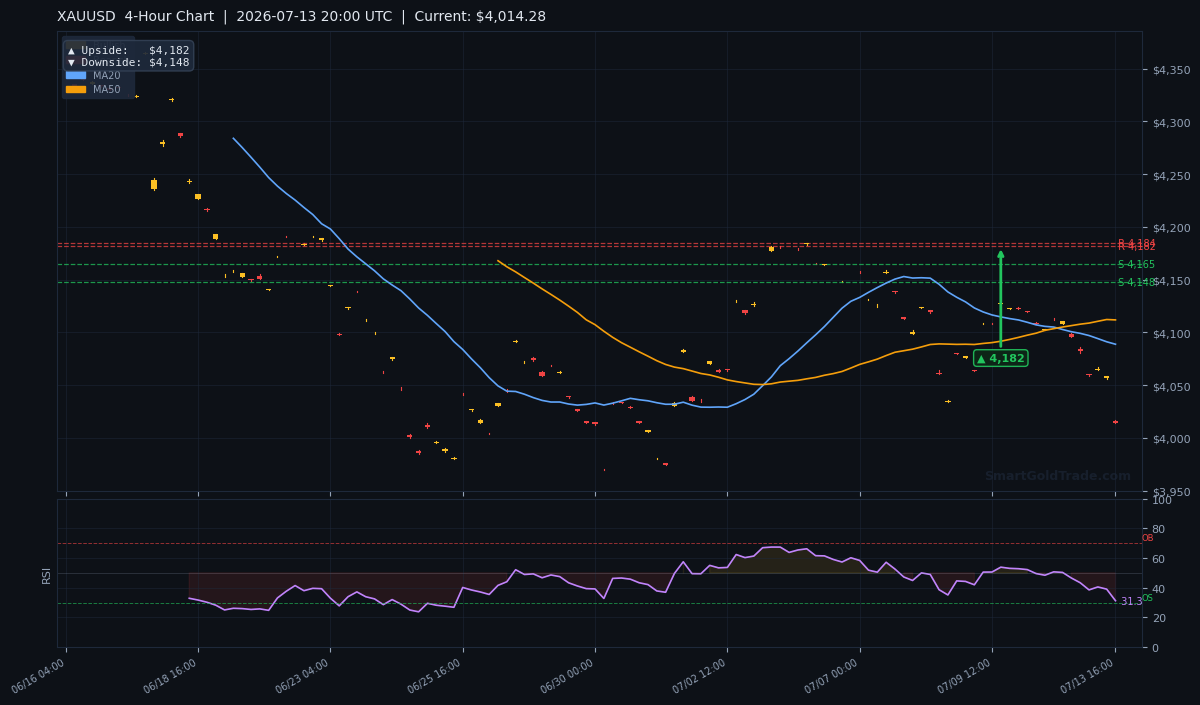
The moving averages paint a bearish picture for the gold price. The 20-period simple moving average sits at $4,088.76, the 50-period MA at $4,111.81, and the 200-period MA at $4,218.73.
The gold price is buried below all three, with the MA20 crossing below the MA50—a classic short-term bearish signal. Recovery above $4,089 would be the first step toward neutralizing the downtrend, but for now the path of least resistance is lower until proven otherwise.
RSI and Momentum
The 14-period Relative Strength Index reads 31.3, creeping into oversold territory. Readings below 30 would signal an extreme oversold condition, often preceding a snapback rally.
At 31.3, the gold price doesn’t yet scream “buy,” but it does warn that sellers are losing momentum and a short-term floor could be near. This is the kind of setup where a rapid 30–$50 bounce can unfold if buyers step in at support.
Key Price Levels
Support levels from the chart have been broken and now act as overhead resistance. S1 at $4,164.51 and S2 at $4,147.61 will cap any rally attempt, while proper resistance stands at $4,184.32 (R1) and $4,181.55 (R2).
With the current gold price at $3,999.88, the only immediate floor is the psychological $4,000 handle and a 1-hour downside target of $4,047. The daily Average True Range is $12.74, so a typical move would stretch between $3,987 and $4,013—tight enough to make a breakout likely.
| Timeframe | Upside Target | Downside Target |
|---|---|---|
| Daily | $4,570 | $4,445 |
| 4-Hour | $4,182 | $4,148 |
| 1-Hour | $4,073 | $4,047 |
Fundamental Drivers
The main catalyst this week is the U.S. Consumer Price Index report for July 2026, due in two days. Markets expect a slight moderation in core inflation, but any upside surprise could reignite hawkish bets and push the gold price below $4,000. Conversely, softer data would weaken the dollar and give the gold price the green light to rally.
Also on the radar is former Fed Governor Kevin Warsh’s testimony before Congress—any hint of a faster tapering timeline would be bearish for gold. Geopolitically, tensions near the Strait of Hormuz have not eased, and that keeps a floor under safe-haven demand even when technicals are bearish.
Key Event to Watch
The U.S. CPI release on July 15 is the clear event risk. A hotter-than-expected print could slam the gold price to $3,980 or lower, while a soft number might propel a run through $4,047 and toward $4,073.
Position-sizing ahead of the data is critical—the American session after the release will almost certainly see elevated volatility. If you’re holding a pre-event position, consider hedging against a breach of $4,000.
Devil's Advocate
What if the bounce never materializes? The most dangerous scenario is a clean break below $4,000 on heavy volume, which would activate sell stops and open the door to the 1-hour downside target of $4,047 and potentially a test of $3,980.
In that case, the bull setup is invalidated and the market would flip to a sell-on-rally regime. A daily close above the broken resistance at $4,147 would be needed to shift the bias back to neutral, but that’s a long way from current levels. Keep risk tight; capitulation below $4,000 is fast and unforgiving.
Trading Strategy for American Session
The core setup is a buy limit at $4,000.00, just above the psychological floor. Place a stop loss at $3,980.00—below the 1-hour downside pivot and roughly two times the ATR, giving the trade room to breathe.
The first take-profit target is the 1-hour upside pivot at $4,073.00, a gain of $73 per ounce. For those who prefer a more conservative exit, partial profits can be booked at $4,047.00. The risk-reward ratio on this gold price setup is 1:3.6 (risk $20 to make $73), which is compelling if the floor holds. Use professional gold trading signals to confirm the bounce before committing full size.
If price rejects $4,073 with a 4-hour bearish engulfing candle, a scalp short back toward $4,047 is also valid. In that case, stop loss above $4,088 (the MA20) and target $4,047. For halal traders, this spot-based, no-leverage approach is ideal—SmartGoldTrade’s platform allows you to own 1/100th of a troy ounce with no swap fees or overnight interest.
Key Takeaways
- Gold price trades near $4,000 at $3,999.88—psychological support is the line in the sand.
- RSI at 31.3 suggests sellers are losing steam and a bounce may be near.
- The 1-hour pivot upside target is $4,073; a clean break opens $4,147.
- U.S. CPI on July 15 is the make-or-break event—volatility will spike regardless of the print.
- The American session setup offers a $4,000 entry with a $3,980 stop and $4,073 target.
- A close below $4,000 on volume would flip the bias bearish and target $3,980.
Conclusion
The gold price is at a critical juncture. The bearish structure is intact, but the RSI and the $4,000 magnet are setting the stage for a powerful short-covering rally. The American session tends to amplify moves after a quiet Asian/European tape, so watch the $4,000 bid closely.
If it holds, the path to $4,073 is relatively clear, with a generous risk-to-reward ratio. However, don’t fight a break below $3,980—that would signal that inflation and rate-hike concerns have completely overwhelmed safe-haven demand. Trade the level, not the noise.
For investors with a longer time horizon, purchasing physical gold coins or bars can be a complementary strategy. While spot gold prices offer quick tactical setups, owning tangible assets like 22K coins and 24K bars hedges against systemic risks and currency debasement. You can purchase physical gold directly from SmartGoldTrade, alongside your halal trading activities.
FAQ
Why is $4,000 such a critical level for the gold price?
$4,000 is a major psychological round number that attracts buyers and acts as a line in the sand for stop-loss orders. A break below often triggers automated selling, while a hold invites dip-buyers. The 1-hour pivot downside target of $4,047 adds cluster support just above it, making the gold price especially sensitive around this zone.
What's the first upside target if the gold price bounces?
The immediate 1-hour chart targets upside pivot at $4,073. A successful break above that level could quickly extend toward the broken support now turned resistance at $4,147 and even the 4-hour target of $4,182.
How does the upcoming CPI data impact the gold price?
July CPI (due July 15) is the dominant risk event. An above-consensus reading would likely push the dollar up and slam the gold price below $4,000. A softer print would weaken the dollar and fuel a rally through $4,073, validating the bounce setup.
Trading Gold (XAU/USD) carries significant risk of loss and is not suitable for all investors. This content is for informational purposes only and does not constitute financial advice. Always conduct your own research and trade responsibly.