
The gold price opened Thursday’s American session at $4,213.53 per troy ounce, finding a modest bid as the US Dollar Index (DXY) slipped below the 99.00 handle. With safe-haven appetite for the Greenback fading fast, bullion is trying to capitalise — but the chart still paints a cautious picture. The question isn’t whether the gold price can wiggle higher intraday; it’s whether buyers can defend ground against a firmly bearish moving-average structure. Here’s the exact roadmap for the next few hours, with levels, triggers, and the one dollar-move that could flip everything.
Gold Price Today: Market Overview
Macro Context
The DXY is nursing losses near 98.75 as risk-on winds lift equities and crush demand for the dollar. When the Greenback weakens, gold typically gets a tailwind, and today that relationship is driving the gold price higher from its Asian low. US Treasury yields have edged down too, with the 10-year dipping to 4.18%, as markets price in a near-certain pause from the Federal Reserve next week. Geopolitical noise hasn’t faded, but the immediate focus is squarely on the dollar.
Central bank buying remains a structural backstop for the gold price as well. The People’s Bank of China and other sovereign buyers have been steadily accumulating reserves, insulating bullion from the kind of deep selloffs that a purely dollar-driven market would invite. So even though the technical trend is soft, the floor isn’t made of glass.
Session Outlook
American hours bring heavyweight liquidity, and the DXY’s inability to reclaim 99 leaves the door cracked for more gold price upside. The medium-term bias is still bearish — spot is trading below every meaningful moving average — so expect fast, two-way action around $4,213. A DXY breakdown below 98.60 would likely kick the gold price toward the first resistance band. On the flip side, any sudden dollar bid that lifts the index back above 99 should cap the move and invite sellers to reload.
Gold Price Technical Analysis
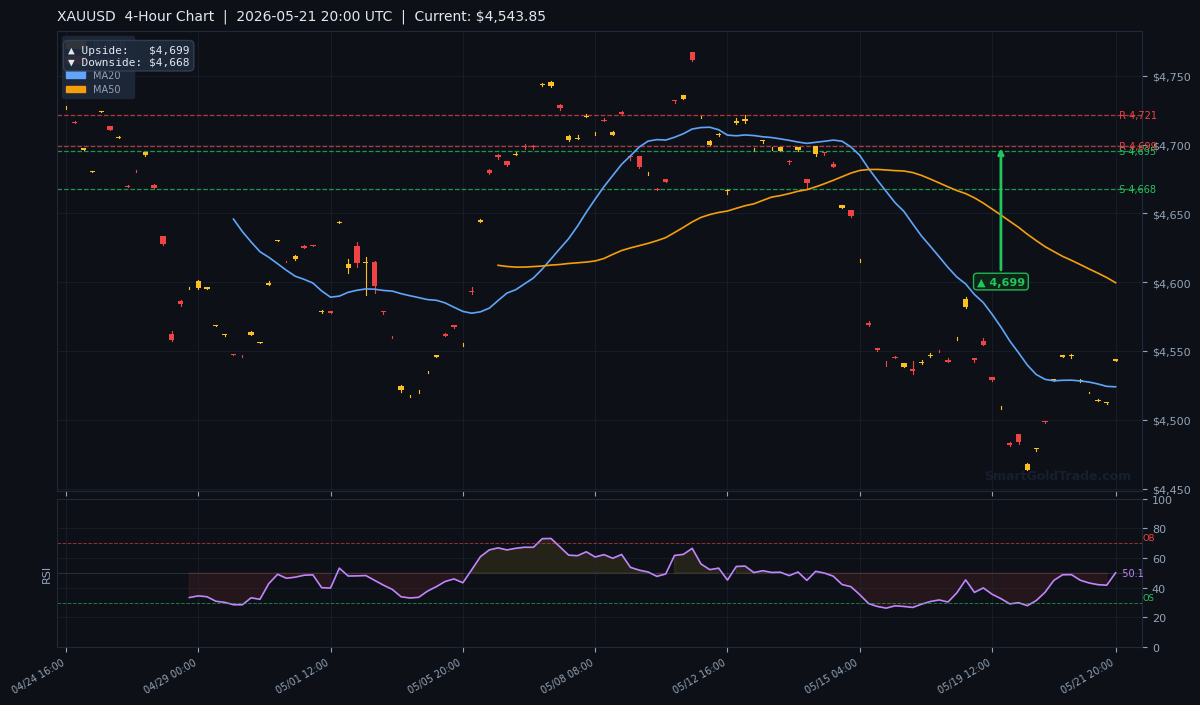
Using the same indicators that SmartGoldTrade’s traders watch on the H4 chart, the picture is clear: the gold price at $4,213.53 sits below the MA20, MA50, and MA200 — a textbook bearish alignment.
Moving Average Structure
The MA20 is parked at $4,221 and the MA50 at $4,258 — a classic short-term death cross that keeps sellers in the driver’s seat. The gold price would need to vault back above $4,221 just to challenge the first layer of resistance, and even then the MA50 looms overhead. The MA200 sits at $4,305, a ceiling that won’t be tested without a big fundamental spark. Until those moving averages flatten or turn higher, rallies are likely selling opportunities.
RSI and Momentum
The RSI(14) reads 38.4 — still in bearish territory but not yet oversold, leaving room for both sides to swing. Momentum is tentative, and a push above the 50 midline would be the first sign that the gold price reversal has legs. For now, the RSI’s slope is drifting sideways, reflecting the indecision traders are feeling near the $4,200 mark.
MACD and Downside Pressure
The MACD line is below the signal line and both are angled lower, while the histogram prints deeper red bars. That configuration suggests that intraday bounces are being sold, and the path of least resistance for the gold price remains down unless the DXY cracks hard. Any bullish divergence on the RSI or MACD would be an early warning that the bearish momentum is exhausting.
Key Price Levels
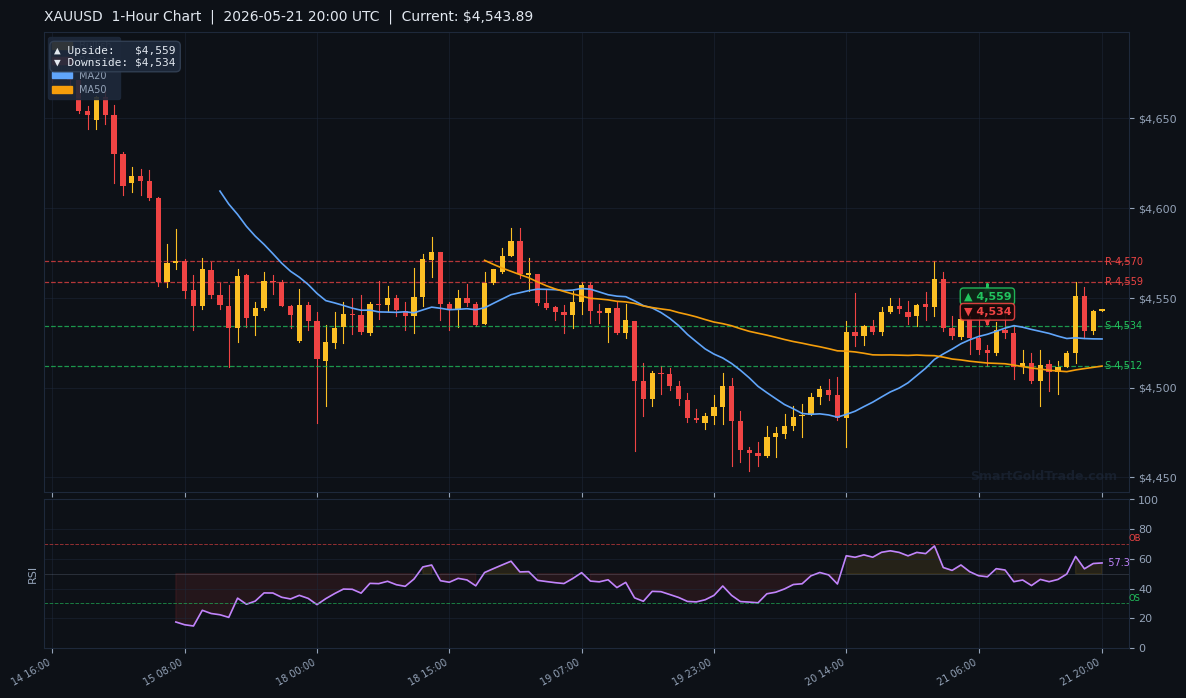
Resistance R1: $4,242 — a level that previously acted as support and now serves as the first ceiling. A 1-hour close above here would put bulls back in the game.
Resistance R2: $4,268 — the next hurdle if the gold price clears $4,242.
Support S1: $4,198 — near the intraday low; losing this opens the trapdoor.
Support S2: $4,180 — followed by the psychological $4,150 area.
The ATR(14) of $18.20 suggests a session range of roughly $36, meaning a push to $4,249 or a dip to $4,177 is easily within the day’s volatility envelope.
Fundamental Drivers of the Gold Price
The dollar’s slide toward 98.75 remains the primary engine. A clean break below 98.60 would likely accelerate gold price buying, while a snap back above 99 would cool the bid. No major US data lands during today’s session, so the DXY will call the shots.
Key Events to Watch This Week
Tomorrow’s US Retail Sales are the headline risk. A weaker print — anything below 0.2% month-on-month — would reinforce the Fed-pause narrative and likely support the gold price. Thursday brings Weekly Jobless Claims, and any spike above 230k could give gold a fresh leg higher. The University of Michigan Sentiment survey on Friday rounds out the calendar; a drop in consumer confidence often sends money flowing into gold as a hedge. Also keep an ear open for Fed officials speaking late in the day — a hawkish surprise could rattle the DXY and pressure the gold price back toward support.
Bearish Scenario: When the Gold Price Could Reverse
The bullish bias evaporates if the DXY stages a rapid recovery from the 98.50 psychological zone. A dollar snapback would yank the gold price below $4,198 in a hurry. The level to watch on the downside is $4,180 — a 1-hour close beneath it would confirm that the bounce was a head fake and that sellers are firmly back in charge. In that scenario, the next downside magnet becomes $4,150, followed by the April swing low near $4,130. The bearish moving-average stack would accelerate the drop, so defensive stops are non-negotiable.
Trading Strategy for Today’s Gold Price Action
For traders who want to play the intraday gold price movements responsibly, here’s a clear plan. A retest of the $4,213 area with bullish confirmation — a pin bar or RSI hooking higher — offers a long entry. Keep the stop below the MA20 at $4,202, roughly 0.7x ATR to give the trade room without taking outsized heat. The first take-profit sits at $4,242 (R1), and a second partial at $4,268 (R2) if momentum holds. If the gold price instead loses $4,198 on a 15-minute close, the short side comes into play, targeting $4,180 and then $4,150, with a stop above the intraday swing high near $4,225.
Traders looking for an edge on exits and entries can lean on professional gold trading signals that deliver real-time levels and take the guesswork out of split-second decisions. And if you follow a Shariah-compliant approach, it’s vital to execute these moves on a platform that avoids swaps, interest, and leverage. SmartGoldTrade’s halal gold trading infrastructure gives you spot exposure with physical ownership and zero overnight fees, so you can focus purely on the gold price without worrying about hidden riba.
Long-Term Gold Investment: Beyond Intraday Moves
Not every investor wants to sit glued to a chart while the gold price ticks. If your goal is long-term, Shariah-compliant wealth building, a more passive route can make sense. SmartGoldTrade’s Shariah-compliant gold investment pools let you participate in gold market returns through quarterly profit-sharing — no daily screen-watching required. These musharakah plans run from six months to three years, offering a genuine alternative for those who believe in the gold price’s long-term uptrend but prefer an ethical, managed approach.
Key Takeaways
- The gold price is holding $4,213.53 as the DXY trades below 99, with 98.75 acting as the line in the sand.
- Technically, the gold price sits below the MA20, MA50, and MA200 — a bearish formation that demands caution.
- Immediate resistance is $4,242; a break above targets $4,268. Support lies at $4,198, then $4,180.
- RSI at 38.4 and a declining MACD reinforce downward pressure, but no oversold signal yet.
- ATR of $18.20 points to a $36 session range — expect sharp swings around the gold price.
- A DXY pop above 99 or a bearish close below $4,180 will decide the next directional move.
Conclusion
The dollar’s weakness has handed gold a lifeline, but the gold price hasn’t escaped the bearish moving-average cage. A decisive push above $4,242 — and ideally a 4-hour close above the MA20 — would signal that momentum is shifting in bulls’ favour. Until that trigger fires, treat any rally as a bounce within a downtrend. Watch the DXY near 98.60 and the gold price’s defence of $4,198 for the next reliable clue.
Frequently Asked Questions
- What is the live gold price right now?
- The gold price at the time of writing is $4,213.53 per troy ounce. This is a real-time rate that moves throughout the global session.
- Why is the gold price rising today?
- The US Dollar Index dropped below 99 and fell toward 98.75, reducing demand for the dollar and making gold more attractive to non-US buyers. Lower Treasury yields are also supporting the gold price.
- What are the key support and resistance levels for gold today?
- Resistance sits at $4,242 and $4,268. Support lies at $4,198, $4,180, and the psychological $4,150 handle.
- Is the gold price in a bullish or bearish trend?
- The medium-term trend is bearish because the gold price trades below the MA50 and MA200. A break above $4,242 and the MA20 would be the first step toward a short-term bullish reversal.
Risk Disclaimer: Trading Gold (XAU/USD) carries significant risk of loss and is not suitable for all investors. This content is for informational purposes only and does not constitute financial advice. Always conduct your own research and trade responsibly.