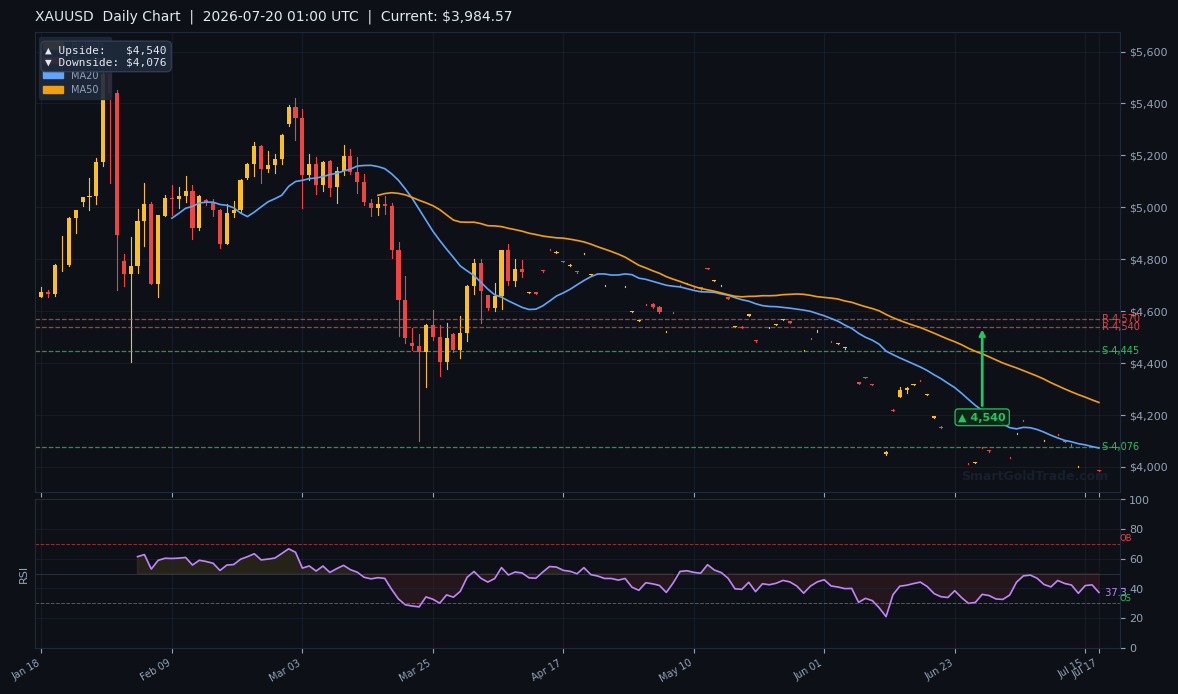
Gold price slipped to $4,013.47 in early Asian trading on Monday, extending last week's bearish momentum as thin liquidity magnified selling pressure. City Index's weekly outlook last week warned that XAU/USD was likely to remain under pressure, and that forecast is materializing with the metal trading well below all major moving averages. The lack of significant economic data in the Asian session shifts focus to technical levels and the risk of a swift move toward the psychological $4,000 barrier. Traders should brace for a session defined by low volume and potential false breakouts — patience will be key.
Gold Price Market Overview
Macro Context
The US Dollar Index remains buoyant near multi-week highs, while 10-year Treasury yields hold above 4.5%, keeping the gold price under pressure. Last week's softer-than-expected US CPI print briefly lifted gold, but the relief rally fizzled as hawkish Fed rhetoric reasserted dominance. Markets now price in a higher-for-longer rate environment, leaving little room for a sustained gold price recovery. Geopolitical concerns — particularly the ongoing Iran tensions — continue to simmer, but have failed to ignite safe-haven buying strong enough to offset macro headwinds.
Session Outlook
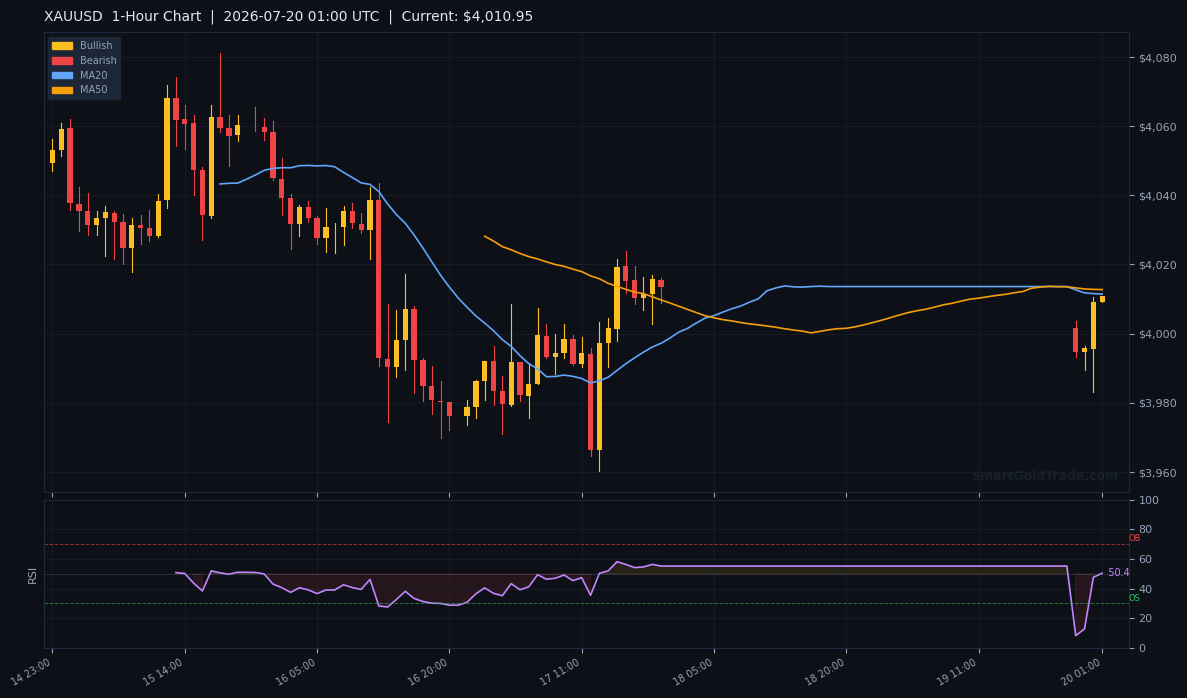
The Asian session typically brings reduced participation from major liquidity providers, and Monday mornings are especially quiet. With no top-tier data releases scheduled for the session, the gold price is likely to drift within a narrow band or test nearby support levels. Thin order books can produce sudden, sharp spikes in either direction, so traders must avoid chasing breakouts that lack volume confirmation. A repeat of late June's thin-liquidity slide, which briefly sent gold below $3,983, cannot be ruled out if stops cluster below $4,013.
Technical Analysis
Moving Average Structure
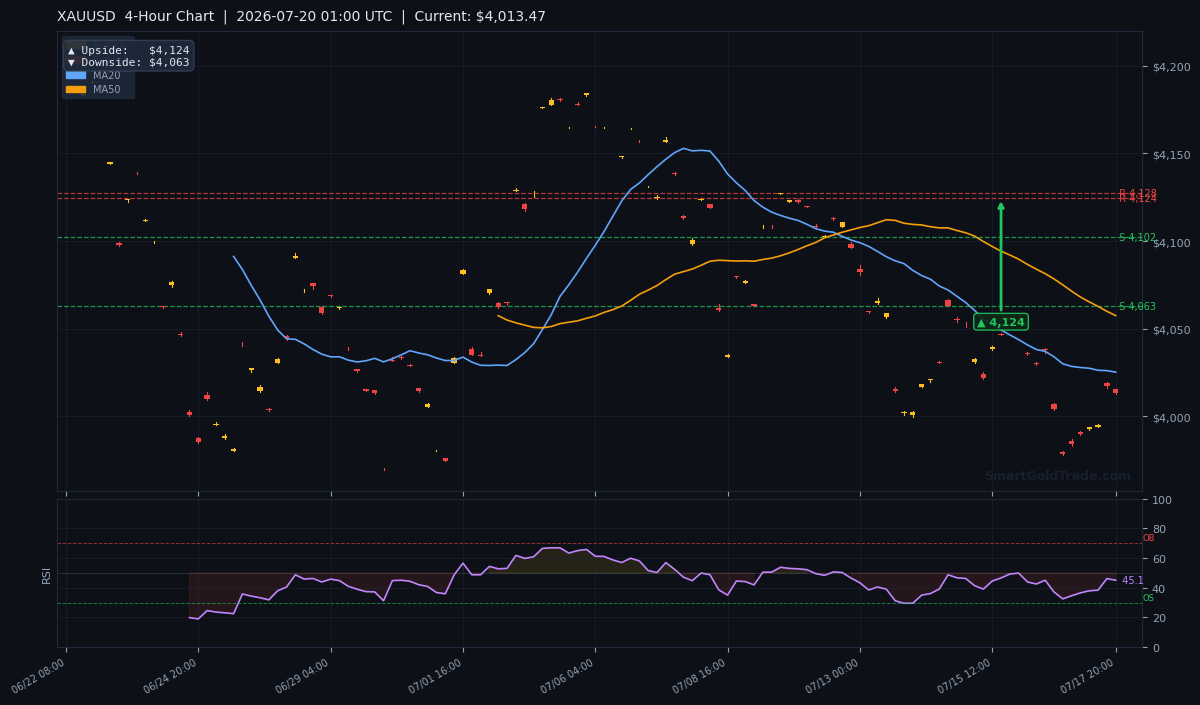
The short-term 20-period moving average sits at $4,025.26, the medium-term 50-period MA at $4,057.47, and the long-term 200-period MA at $4,159.27. The gold price trades below all three, establishing a clear bearish alignment on the 4-hour chart. The MA20 crossing below the MA50 late last week reinforced the downtrend, with each moving average now acting as overhead resistance on any attempted bounce. Until price reclaims at least the MA20, short positions carry the structural advantage.
RSI and Momentum
The 14-period RSI reads 45.1, perched in neutral territory but tilting lower. This indicates the gold price is not yet oversold, leaving ample room for further downside before any mean-reversion buyers step in. Momentum on shorter timeframes is waning, with no bullish divergence visible. A drop in RSI below 40 would confirm accelerating selling pressure and likely coincide with a break of $4,000.
Key Price Levels
Support levels from last week's structure — S1 at $4,147.61 and S2 at $4,124.26 — have been cleanly broken and now act as remote resistance. For the gold price, the immediate challenge for any recovery is the $4,025 MA20 area. Above that, R1 at $4,164.23 and R2 at $4,159.15 form a ceiling that would require a fundamental catalyst to crack. On the downside, the first meaningful support emerges at the 4-hour target of $4,063, followed by the psychological $4,000 level. The Average True Range (ATR) of $12.14 suggests intraday swings of roughly this magnitude, making the $4,063–$4,000 zone an achievable target if bearish momentum persists.
| Timeframe | Upside Target | Downside Target |
|---|---|---|
| Daily | $4,540 | $4,076 |
| 4-Hour | $4,124 | $4,063 |
| 1-Hour | N/A | N/A |
Fundamental Drivers
The primary fundamental backdrop remains the same: a resilient US economy and stubborn inflation readings keep the Federal Reserve in a hawkish posture, supporting the dollar and punishing the gold price. City Index's weekly outlook, published late last week, explicitly projected ongoing pressure on XAU/USD, and the technical breakdown below $4,124 has validated that thesis. Geopolitically, the Iran conflict continues to inject a risk premium, but it acts more as a floor than a catalyst for a rally — true safe-haven buying will only emerge if the situation escalates dramatically or if risk assets sell off sharply.
Key Event to Watch
Wednesday's US Flash PMI data is the standout event this week. A reading that misses expectations could spark a temporary dollar pullback and lift the gold price toward the $4,025 MA20 resistance. Conversely, an upside surprise would reinforce the higher-for-longer narrative, likely sending gold into the $4,063 support zone. Traders should note that any knee-jerk reaction will be amplified by the thin liquidity environment prevalent throughout the week.
Devil's Advocate
The bearish bias rests on the assumption that macro headwinds persist and technical resistance holds. However, if gold price stages a clean daily close above the $4,025.26 MA20 — something that would require a sharp dollar reversal or a geopolitical shock — the short-term bearish structure would be challenged. A move beyond $4,124.26, the broken S2 that now acts as resistance, would flip the 4-hour trend neutral, and a push past $4,147.61 would invite buyers to test R1 at $4,164.23. Under that scenario, any short positions must be cut swiftly to avoid a squeeze. Seasoned investors often view these pullbacks as accumulation phases, building positions for a longer-term gold price recovery. A sustained gold price recovery above $4,025 would shift sentiment quickly, so bears must stay nimble.
Trading Strategy for Asian Session
The most coherent play in a low-volume Asian session is to sell rallies rather than chase breaks to the downside. An entry zone between $4,013 and $4,015 offers a favourable risk-reward profile, with a stop loss placed above the MA20 at $4,028 — slightly beyond the ATR-based expected whipsaw. The first take profit target rests at the 4-hour downside level of $4,063, with a second target at the psychological $4,000 level. This gives a risk of approximately $13–$15 against a potential reward of $50–$60, offering a near 1:4 ratio. A similar thin-liquidity sell-off in late June took gold to $3,983, a reminder of how fast these moves can unfold; you can revisit that episode in our breakdown of the $3,983 dip.
For those seeking a Shariah-compliant approach to trading gold without leverage, halal gold trading provides a riba-free way to participate in gold price moves with physical ownership. Traders who prefer not to sit through low-volume drifts can leverage professional gold trading signals to identify high-probability setups with clear stop-loss and take-profit levels. Alternatively, if you’d rather let experts handle the trades, copy trading automatically mirrors top-performing gold traders — a halal, hands-off way to follow the gold price without staring at charts.
Key Takeaways
- Gold price at $4,013.47 sits below the MA20, MA50, and MA200, confirming a bearish structural landscape.
- The 4-hour RSI of 45.1 signals neutral momentum with room to decline before oversold conditions emerge.
- Overhead resistance clusters between $4,025 (MA20) and $4,164 (R1); any rally into this zone is a potential short entry.
- Downside targets in the coming sessions are the 4-hour pivot of $4,063 and the critical $4,000 psychological barrier.
- Daily ATR of $12.14 suggests gold can move $12–$14 in either direction, making stop placement below or above these swings essential.
- Wednesday's Flash PMI data and the dollar's reaction will likely determine whether gold tests $4,000 this week.
Conclusion
Gold price begins the week on the back foot, trading at $4,013.47 in an Asian session starved of liquidity. The alignment of moving averages, neutral but declining RSI, and a hostile macro backdrop all argue for further downside. While the $4,063 level is the immediate destination, a closure below $4,000 would open the door to the daily downside target of $4,076. Bulls need a catalyst — either a clear PMI miss or a geopolitical upheaval — to reclaim the $4,025 MA20 and challenge $4,124. Ultimately, the gold price trajectory hinges on the dollar and the Fed's tone. Until that materializes, patience and short-side discipline will serve traders best in this environment.
Frequently Asked Questions
- Why is gold price falling in the Asian session today?
- The gold price is under pressure from a strong US dollar and elevated Treasury yields, with thin Asian liquidity magnifying the selling. Last week's bearish weekly outlook from City Index and the technical break below $4,124 support have extended the downtrend.
- What are the key support levels for gold this session?
- The immediate downside target is the 4-hour level at $4,063, followed by the psychological $4,000 handle. A daily close below $4,000 would expose the daily downside target at $4,076.
- Is $4,000 a strong support for XAU/USD?
- The $4,000 level carries significant psychological weight and has acted as support multiple times in recent weeks. However, with the RSI still neutral at 45.1 and no oversold signal, a break below $4,000 is plausible if macro conditions do not improve for gold.
- Should I buy gold now at $4,013 or wait for a dip?
- The technical and fundamental picture currently favours further downside. A more prudent entry for long positions would be a confirmed bounce from the $4,063 support or a daily close above the $4,025.26 MA20. Catching a falling knife in thin liquidity carries elevated risk.
- What market event could reverse gold's downtrend this week?
- If Wednesday's US Flash PMI data comes in significantly below expectations, the dollar could weaken and lift the gold price back toward $4,025 and possibly $4,124. An unexpected escalation in the Iran conflict could also trigger a sharp safe-haven bid, invalidating the bearish bias.
Risk Disclaimer: Trading Gold (XAU/USD) carries significant risk of loss and is not suitable for all investors. This content is for informational purposes only and does not constitute financial advice. Always conduct your own research and trade responsibly.