Gold price is under renewed selling pressure this Wednesday, trading at $4,034.77 after yesterday's sharp 0.44% decline. Tuesday's session saw XAU/USD retreat from the $4,200 threshold as US consumer inflation expectations ticked higher, dampening hopes for near-term Fed rate cuts. Adding to the risk-off tone, reports of attacks in the Strait of Hormuz escalated Middle East geopolitical jitters — yet gold failed to benefit from haven demand.
Now, traders are left asking whether the metal can find a floor or if a deeper drop toward $4,120 is on the cards. With the FOMC minutes from the June meeting due later in the American session, volatility is likely to spike, making today's price action a critical test for bulls.
Gold Market Overview
Macro Context
The US Dollar Index (DXY) held firm above 104.50, while the 10-year Treasury yield stayed elevated above 4.30%, creating a stiff headwind for the non-yielding metal. A University of Michigan survey released yesterday showed one-year inflation expectations rising to 3.4% from 3.2%, reinforcing the view that the Federal Reserve may keep rates higher for longer. Markets had been pricing a 25-basis-point cut in September, but sticky inflation sentiment is now chipping away at that narrative.
Geopolitical risk escalated sharply with reported attacks in the Strait of Hormuz, threatening oil supply routes. Normally, such turmoil would spark a flight to gold, but the stronger dollar and higher real yields have muted the typical safe-haven bid this time.
Session Outlook
The American session brings deep liquidity and the potential for fast moves. With the ATR(14) at $20.13, the gold price could swing in a $40–$50 range once the FOMC minutes hit at 2:00 PM ET. Expect initial support near $4,020 and resistance around $4,080, but a hawkish surprise could push the metal toward the $4,120–$4,100 zone. Conversely, a dovish lean might spark a rapid short-squeeze back to the $4,165–$4,184 area.
Gold Price Technical Analysis
Moving Average Structure
Current price at $4,034.77 sits below all three major moving averages — a clear bearish configuration. The 20-period MA reads $4,138.29, the 50-period MA is at $4,088.86, and the 200-period MA towers at $4,258.16. Price has sliced through both the short- and medium-term MAs this week, turning them into overhead resistance. However, the EMA structure still shows the 20-period above the 50-period, a remnant of the prior short-term bullish momentum. That alignment is fading fast and will only matter if bulls manage to reclaim the $4,138 level.
RSI and Momentum
The 14-period RSI dropped to 35.2, well inside the neutral band but leaning toward oversold territory. This isn't a buy signal yet — momentum can stay depressed in a downtrend — but it does suggest that selling may soon become exhausted if the FOMC news doesn't deliver a fresh bearish shock. Any bounce from here would likely attract sellers at the first layer of former support, now resistance.
Key Price Levels
Support levels from the indicator set — S1 at $4,164.51 and S2 at $4,147.61 — now lie above the market, effectively acting as resistance. On the upside, R1 stands at $4,184.32 and R2 at $4,181.55, forming a tight band that needs to be cleared for any meaningful recovery. The ATR-based daily range projects a lower boundary near $4,014 and an upper boundary around $4,074, making the $4,120 pivot target from the 1-hour chart a realistic downside goal if bearish momentum builds.
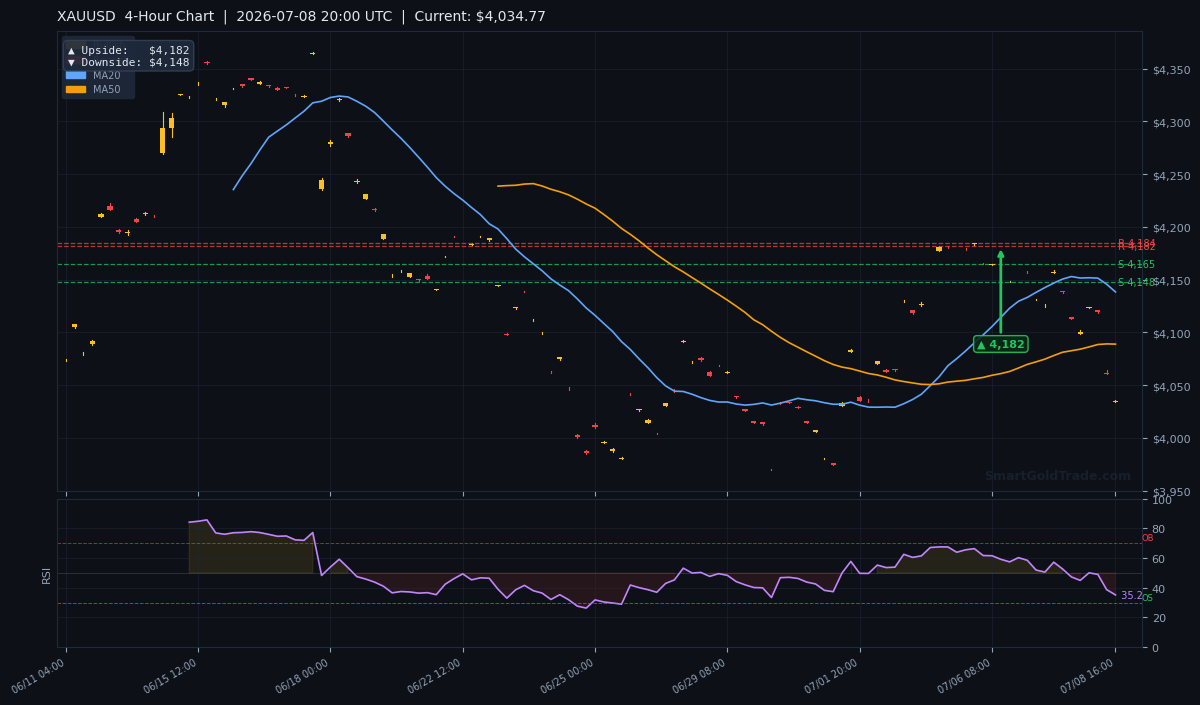
The 4-hour picture confirms the breakdown, with the next visible anchor at the H4 downside arrow target of $4,148 — already breached intraday, signaling that sellers are firmly in control.
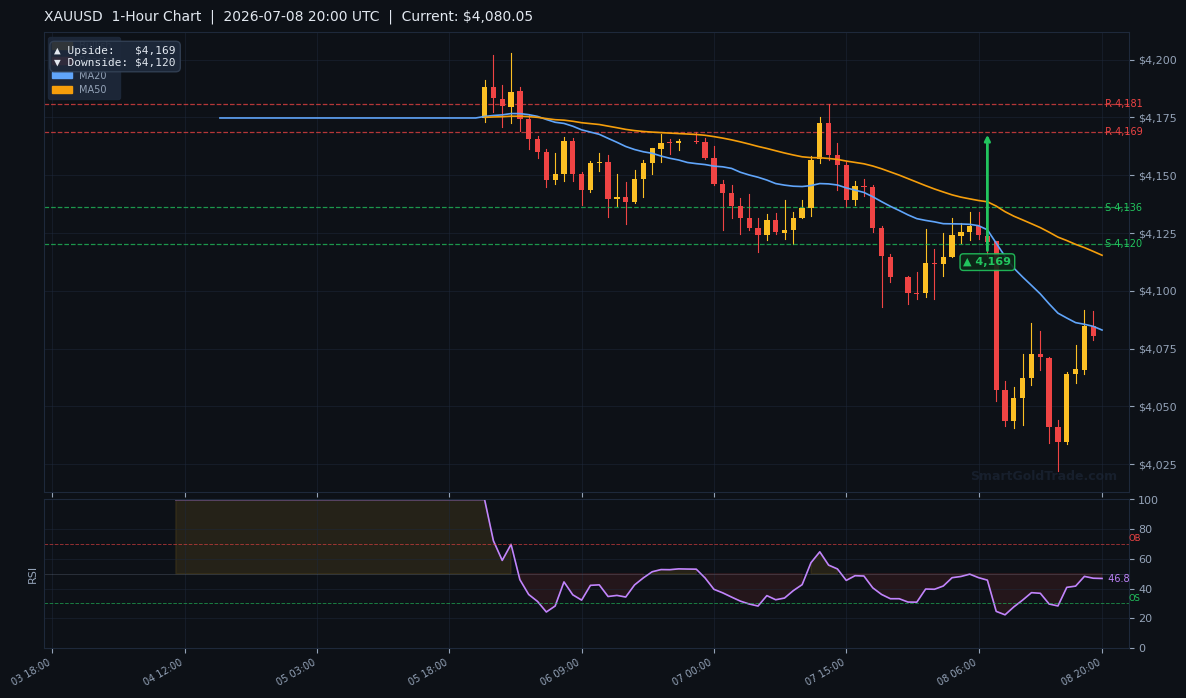
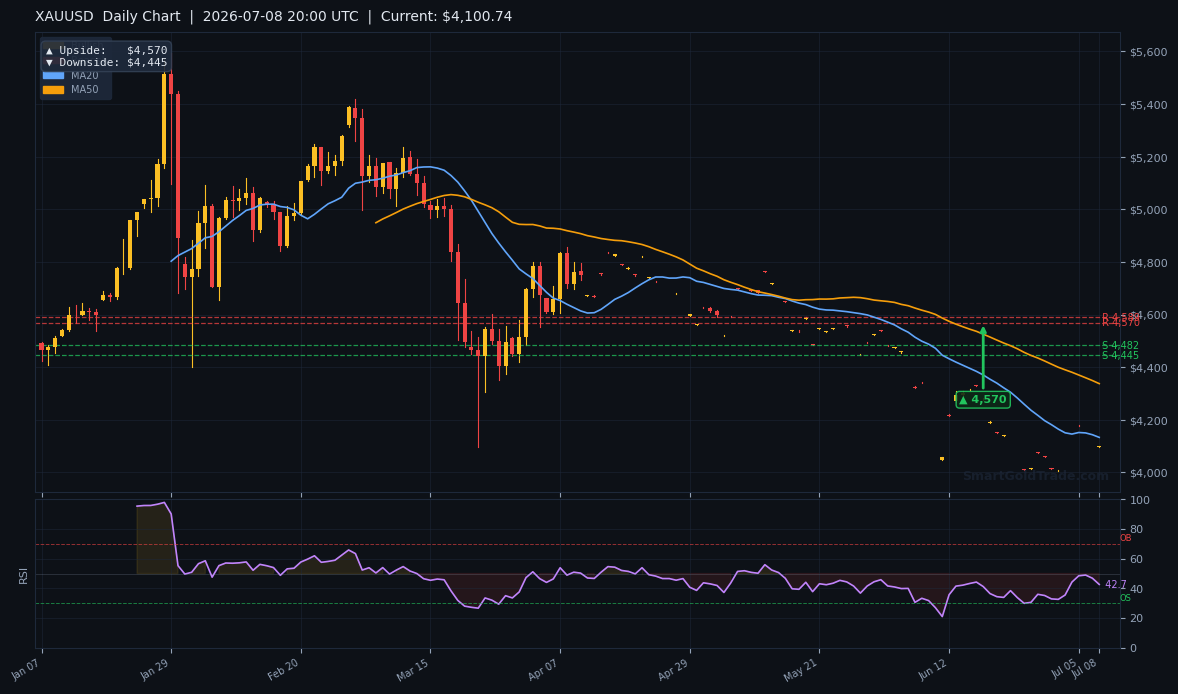
On the 1-hour chart, the immediate bearish objective is the pivot arrow at $4,120, while bulls would need to clear $4,169 just to stabilize. The daily chart's broader targets — $4,570 upside and $4,445 downside — remain distant but underline how stretched the market has become to the downside.
Fundamental Drivers
Yesterday's surge in US consumer inflation expectations was the primary catalyst for the gold sell-off. As long as households anticipate higher prices, the Fed is unlikely to declare victory on inflation, keeping rate-cut expectations in check. Meanwhile, the Strait of Hormuz attacks injected geopolitical risk, but the dollar benefited more from the flight to safety than gold did, highlighting the current correlation dynamics where DXY strength trumps bullion's traditional haven role.
Treasury yields barely budged, yet real yields remain punishingly high for a zero-yield asset. This combination — hawkish inflation data, rising real rates, and a resilient dollar — creates an unforgiving backdrop for gold. Any relief would require a clear dovish signal from the Fed, which makes today's FOMC minutes the linchpin.
Key Event to Watch
The FOMC minutes from the June 10–11 meeting, released at 2:00 PM ET, are the standout trigger. Traders will scrutinize the debate over inflation persistence and whether any members favored preemptive rate cuts. A hawkish lean that questions the September easing timeline could send gold straight to $4,120. A dovish surprise, hinting at a willingness to cut soon, could ignite a rapid rebound toward $4,184.
Devil's Advocate
The bearish bias evaporates if gold holds above $4,100 and reclaims the $4,147–$4,165 zone on a daily close, especially after the FOMC minutes. A move back above $4,184 would flip the short-term trend bullish, with targets at $4,200 and eventually the daily arrow at $4,570. A sharp upside surprise on geopolitical tensions — such as an all-out supply disruption — could trigger a massive short squeeze, overriding all technicals. So while the path of least resistance is lower, the setup is fragile.
Trading Strategy for American Session
The preferred approach is to sell rallies into the former support zone. An entry window around $4,147–$4,165 offers a high-probability short, provided price shows rejection signals such as a bearish engulfing or pin bar on lower timeframes. Place a stop loss at $4,186, just above R1, to allow for ATR-based noise. The initial take-profit target is the 1-hour pivot at $4,120, with a second scale-out at $4,100 if momentum accelerates after the FOMC release.
Aggressive traders can consider a breakout short below $4,030 with a tight stop at $4,050 and the same $4,120 objective. However, given the proximity to the event, volume will be thin ahead of the minutes, so position sizing is critical. Those who prefer a neutral stance may wait for the initial post-minutes reaction and then trade the retest of either the $4,184 resistance or the $4,120 support.
For longer-term investors, buying physical bars during such dips can be a sensible hedge. Many savvy market participants purchase physical gold to hold through volatile cycles, and some also use halal gold trading to avoid interest and leverage. Meanwhile, traders seeking precise entry points may benefit from professional gold trading signals that provide real-time alerts on setups like this one.
Key Takeaways
- Gold price trades at $4,034.77, having sliced below the 20-period MA ($4,138) and the 50-period MA ($4,089).
- The RSI at 35.2 signals neither oversold nor overbought, leaving room for further downside.
- Immediate support-turned-resistance sits at $4,147–$4,165, while the next bearish target is $4,120.
- Yesterday's rise in US 1-year inflation expectations to 3.4% and Strait of Hormuz tensions pressured gold.
- The FOMC minutes at 2:00 PM ET are the session's main catalyst — a hawkish release could drive a test of $4,100.
- A daily close above $4,184 would invalidate the bearish bias and open the door to $4,200+.
Conclusion
Gold price enters the American session in a precarious position after breaking below the $4,147–$4,165 support shelf. Rising inflation expectations and a firm dollar have shifted the narrative, and the FOMC minutes will either confirm the bearish momentum or trigger a sharp reversal. The immediate downside objective is $4,120, while resistance at $4,184 remains the line in the sand for bulls. Traders should brace for a volatile afternoon and let the market show its hand before committing size. The bias leans bearish below $4,165, but a dovish surprise could rapidly change the picture.
FAQ
- What is the gold price today?
- As of July 8, 2026, the gold price (XAU/USD) is $4,034.77, down 0.44% from the previous session as US inflation expectations rose.
- Why did gold price fall on Tuesday?
- Gold retreated from the $4,200 area after a University of Michigan survey showed consumer inflation expectations jumping to 3.4%. Combined with Strait of Hormuz tensions that boosted the dollar, safe-haven flows bypassed gold.
- What is the next support level for gold?
- The 1-hour pivot target at $4,120 is the immediate support. Below that, the $4,100 psychological round number and the daily downside objective at $4,445 come into play.
- Can gold price recover during the American session?
- A recovery is possible if the FOMC minutes reveal a dovish tone. Bulls would need to push gold back above $4,147 and ideally clear $4,184 to regain control. Until then, selling pressure dominates.
Trading Gold (XAU/USD) carries significant risk of loss and is not suitable for all investors. This content is for informational purposes only and does not constitute financial advice. Always conduct your own research and trade responsibly.