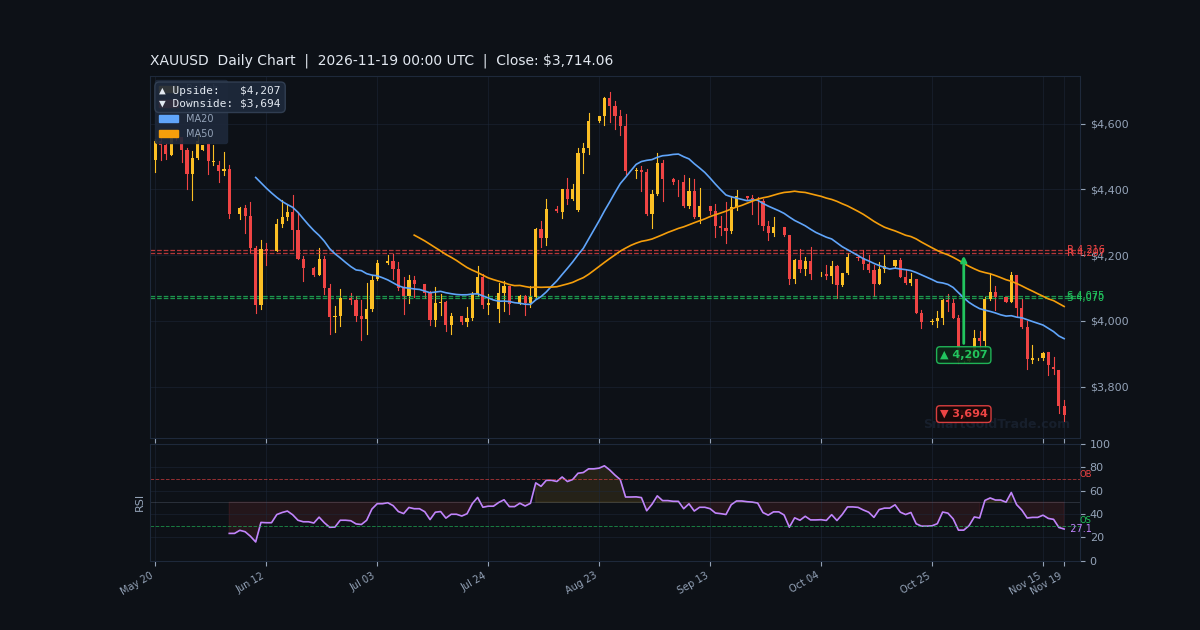
The gold price is holding near $3,719.89 in the American session, clinging to a 14-month low after Wednesday's 3.19% slide. Thursday's tape is a tug-of-war: a softer dollar offered a brief bounce, but hawkish Fed minutes capped every rally attempt. Reuters noted gold recouped from its 14-month low, yet a tighter Fed outlook kept gains in check.
That is the entire story right now. Buyers are cautious, sellers are patient, and the market is waiting for a fresh catalyst. The October FOMC minutes, released Wednesday, did the damage — a couple of officials floated a larger December hike, and inflation since then has run hot.
With no high-impact USD data on the near horizon, this session is about positioning. Watch whether $3,693.53 holds or $3,758.56 gets reclaimed.
Gold Market Overview
Macro Context
The macro backdrop is a headwind, and it is not subtle. The 10-year TIPS real yield sits at 2.89%, up 0.23 week-over-week, while the 10-year nominal yield is at 5.10%. Higher real yields raise the opportunity cost of holding a non-yielding metal.
The broad dollar index is at 122.7, up 1.1 week-over-week. Fed speakers reinforced the hawkish tone: Waller floated a 50-bps shock hike, Musalem wants several more, and Logan called for two. Danske expects 25-bps hikes in December, January and March.
SPDR GLD holdings fell 4.6 tonnes to 1,044.1 t, a clear outflow. COT speculators remain net long at +190,107 contracts — a stale long base that can still be flushed. News sentiment reads -0.35, a hawkish, risk-on tilt.
Session Outlook
American session liquidity should pick up, but the calendar is thin. Expect a contained range anchored by ATR of $17.69. The daily open at $3,728.48 is the first pivot; a hold below it keeps sellers in charge.
Triggers are headline-driven: any Fed speaker leaning hawkish extends the slide, while a soft dollar bounce lifts gold toward the VWAP at $3,731.63.
Technical Analysis
Moving Average Structure
The trend is bearish and stacked against buyers. The EMA20 at $3,738.38, EMA50 at $3,774.09 and EMA200 at $3,887.74 all sit above price. The EMA20 is below the EMA50, confirming downside momentum.
On the higher timeframes, the H4 close at $3,720.08 is below its EMA50 at $3,877.64, and the D1 close is below its EMA50 at $4,072.64. Every layer of structure says the path of least resistance is lower.
RSI and Momentum
RSI(14) is at 39.6, neutral but leaning weak. On H4 it is 24.8 and on D1 29.5 — both flirting with oversold, which can slow selling but has not reversed the trend. Stochastics read 48.1/53.3, mid-range.
MACD is at -14.79 with signal at -17.09 and a histogram of +2.31 — a modest bullish cross that hints at a bounce, not a reversal. ADX at 31.5 with -DI 27.67 versus +DI 13.53 confirms a strong downtrend.
Key Price Levels
Support sits at $3,693.53 (S1), with a deeper floor near $3,693.53 on the daily and 4-hour pivot arrows. Resistance is $3,758.56 (R1) and $3,790.54 (R2). The 61.8% Fibonacci at $3,718.37 is the immediate line in the sand.
The ATR-based expected range for this session is roughly $3,708.98–$3,738.38. A close below $3,693.53 opens the $3,693.53 downside target; reclaiming $3,758.56 shifts the short-term tone. October's minutes showed a close call on holding rates, with almost all participants seeing further hikes as consistent with projections. Waller's call for a 50-bps shock hike and Musalem's push for several more have hardened expectations.
J.P. Morgan now sees hikes at the next three meetings as inflation persists. China is expected to hold benchmark lending rates in November, a mild offset. The U.S., China and Russia agreeing to boost energy supplies after a summit could ease inflation pressure over time — but not this week.
The dollar is the transmission channel. A firm DXY keeps gold expensive for foreign buyers, and elevated yields reduce its appeal. GLD outflows and a hawkish sentiment score of -0.35 confirm the drag.
Key Event to Watch
With the calendar empty, Fed speakers are the event. Any official echoing Waller's 50-bps push would pressure gold toward $3,693.53. A softer tone could spark a squeeze toward $3,758.56.
Unified Technical & Fundamental Outlook
Both pillars are bearish and aligned. The technical score is -0.75: H1 trend down, price below the EMA200, EMA20 below EMA50, and H4 and D1 closes below their EMA50s. The fundamental score is -0.52: rising real yields, a rising dollar, GLD outflows and a hawkish sentiment tilt.
Combined, the assessment is -0.64, aligned bearish. The one conflict is the positive MACD histogram, a short-term bounce signal that does not override the trend. Treat rallies as corrective until $3,758.56 is reclaimed.
Devil's Advocate
What could invalidate the bearish bias? A hawkish Fed is fully priced, so any dovish surprise — a soft speaker or a weak data print — could trigger a violent short squeeze. The stale COT long base at +190,107 is fuel if sentiment flips.
The key reversal level is $3,758.56. A decisive close above it, with RSI pushing back over 50, would flip the short-term trade. A break below $3,693.53 instead confirms continuation toward $3,693.53 and beyond.
Trading Strategy for American Session
The bias is bearish, so sell rallies into resistance. The primary entry zone is $3,738.38–$3,758.56, near the EMA20 and R1. Place a stop above $3,774.09, roughly one ATR beyond entry, to cap risk.
First take-profit is $3,719.89, the current price and PDL; the second is $3,693.53. A break below S1 opens the $3,693.53 downside target. Risk-reward improves if you wait for a rejection candle at resistance.
For a counter-trend long, wait for a hold above $3,731.63 (VWAP) with a stop below $3,710.57 and a target at $3,758.56. Keep size small — the trend is not your friend here. If you want structured execution, professional gold trading signals can help time entries around these levels.
Key Takeaways
- The gold price holds $3,719.89, near a 14-month low, with a bearish combined score of -0.64.
- Price sits below the EMA20 at $3,738.38, EMA50 at $3,774.09 and EMA200 at $3,887.74.
- Key support is $3,693.53; resistance is $3,758.56 and $3,790.54.
- Real yields at 2.89% and a dollar index at 122.7 keep the pressure on.
- GLD holdings fell to 1,044.1 t, a 4.6-tonne outflow.
- ATR of $17.69 implies a session range of roughly $3,708.98–$3,738.38.
Conclusion
The gold price is trapped in a bearish structure, and the fundamentals reinforce it. With the Fed leaning hawkish, real yields rising and the dollar firm, rallies are corrective until proven otherwise. The line in the sand is $3,693.53 on the downside and $3,758.56 on the upside.
Watch the American session for Fed headlines and dollar direction. A break of support accelerates the slide; a reclaim of resistance forces a rethink. If you prefer owning metal outright, you can purchase physical gold as a longer-term hedge against this volatility.
Frequently Asked Questions
- Why is the gold price falling today?
- Hawkish Fed minutes and calls for faster hikes lifted real yields to 2.89% and the dollar to 122.7, pressuring gold toward $3,719.89.
- What is the key support level for gold right now?
- The immediate floor is $3,693.53 (S1), with the daily and 4-hour downside pivot at $3,693.53. A close below opens further losses.
- What resistance must gold reclaim to turn bullish?
- A decisive close above $3,758.56 (R1) would shift the short-term tone, with the next hurdle at $3,790.54.
- How do rising real yields affect the gold price?
- Higher real yields raise the opportunity cost of holding gold, which pays no interest. At 2.89%, that is a clear headwind.
- What is the expected trading range this session?
- With ATR at $17.69, the expected range is roughly $3,708.98–$3,738.38, barring a Fed headline surprise.
Trading Gold (XAU/USD) carries significant risk of loss and is not suitable for all investors. This content is for informational purposes only and does not constitute financial advice. Always conduct your own research and trade responsibly.