
The gold price is trading at $4,748.75 to start the Asian session on May 12, 2026, holding above a cluster of bullish moving averages. After last week's moderate gains, momentum has cooled, and thin liquidity in early Asian hours demands patience from traders. The day ahead sets up as a potential pivot point — with daily resistance at $4,857 within striking distance if buyers regain conviction.
Gold Market Overview
Macro Context
The US Dollar Index (DXY) remains under pressure near two-month lows, providing a favourable tailwind for the gold price. Treasury yields have edged lower as markets price in a higher probability of a Fed pause at the June meeting. Meanwhile, crude oil is edging higher during Asian hours, recovering from last week's near 3% decline, which may add to inflation expectations and support gold's appeal as a hedge.
Session Outlook
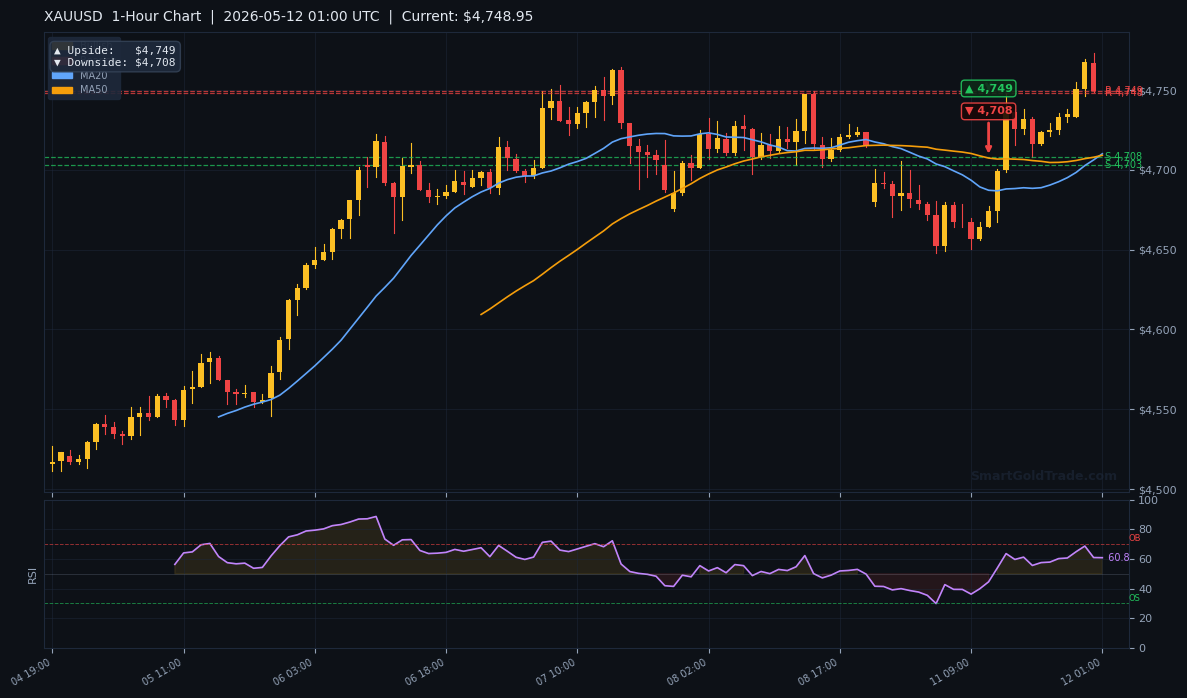
The Asian session is characterised by lower liquidity, which can exaggerate short-term moves. The gold price is likely to range between $4,703 and $4,749 on the 1-hour chart, with a break of either level setting the tone for the European open. Traders should avoid chasing moves in thin conditions and instead focus on established support and resistance levels for entry.
Technical Analysis
Moving Average Structure
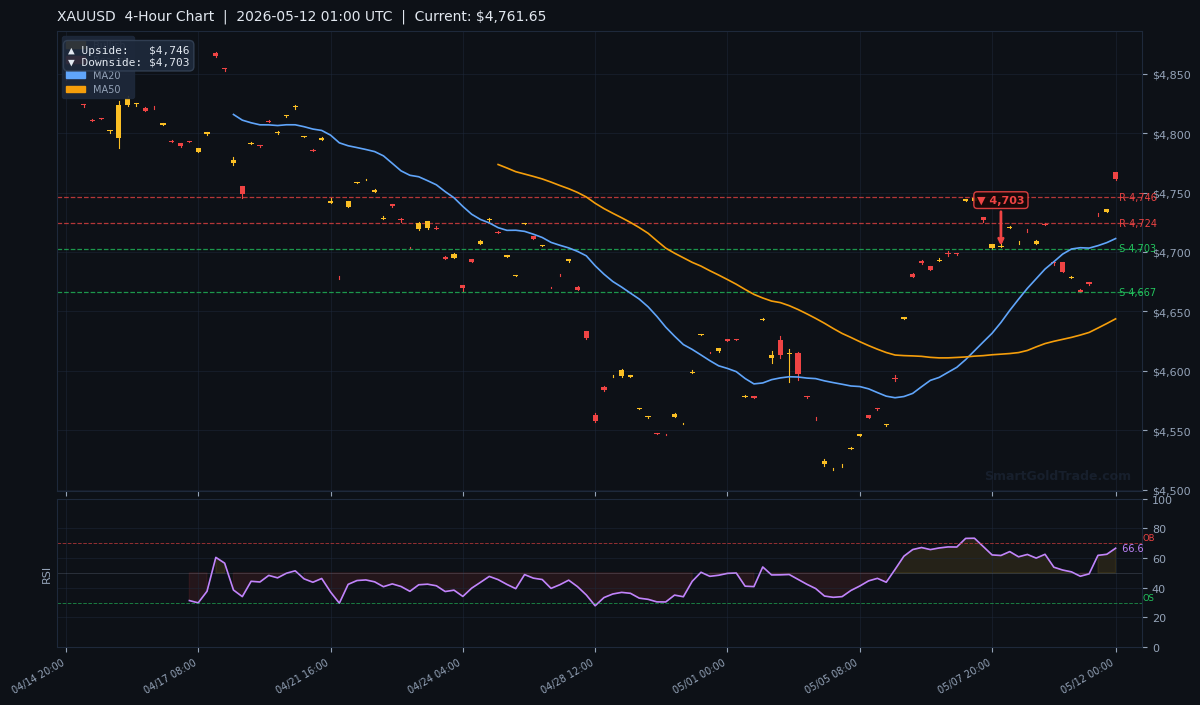
The 4-hour chart reveals a clear bullish alignment. The MA20 stands at $4,711.30, the MA50 at $4,643.79, and the MA200 at $4,679.32. The gold price is trading above all three, confirming a short-term, mid-term, and long-term uptrend. The EMA structure — MA20 > MA50 — adds to the bullish momentum signal. Any pullback toward the MA20 near $4,711 would represent a potential value zone for buyers.
RSI and Momentum
The RSI(14) on the H4 timeframe sits at 66.6, squarely in neutral territory. This level indicates that the gold price is neither overbought nor oversold, leaving room for further upside without immediate exhaustion risk. A move above 70 would signal overbought conditions, while a drop below 50 would suggest a shift in momentum to bearish.
Key Price Levels
Based on live H4 data, support stands at S1: $4,702.94 and S2: $4,666.72. Resistance is at R1: $4,745.97 and R2: $4,724.42. Note that R2 ($4,724.42) is slightly below R1 — this is a zone rather than a linear ladder. The ATR(14) of $16.70 suggests the gold price could experience a daily range of roughly $33, which aligns with the tight consolidation we are seeing.
The pivot arrows on the daily chart point to an upside target of $4,857 and a downside target of $4,667. On the 4-hour chart, upside is $4,746 and downside $4,703. The 1-hour chart shows upside to $4,749 and downside to $4,708.
Fundamental Drivers
Aside from the DXY weakness, the key fundamental driver this week is the Fed's rhetoric. Several Fed speakers are scheduled, and any dovish comments could push the gold price through the $4,746 resistance. On the geopolitical front, tensions in the Middle East remain elevated, supporting safe-haven demand.
Key Event to Watch
The single most important event this week is Thursday's US Producer Price Index (PPI) release. If PPI comes in below expectations, it would reinforce the disinflation narrative and fuel expectations of a Fed rate cut, potentially driving the gold price toward the $4,857 daily target. A hot reading, conversely, could trigger a sharp pullback to $4,667 support.
Devil's Advocate
Despite the bullish setup, the gold price remains vulnerable to a false breakout. If the price fails to hold above $4,703 (the 4-hour downside pivot), a slide to the MA20 at $4,711 and then to $4,667 is possible. A break below $4,667 would invalidate the daily bullish structure and flip the bias to bearish. Additionally, a sudden USD rally — often triggered by safe-haven flows into the dollar — could reverse gold's gains.
Trading Strategy for Asian Session
Given the quiet Asian session, a patient approach is recommended. Look for entries near $4,703–$4,711 (the 4-hour downside pivot and MA20 zone) with a stop loss at $4,690 (below the S1 level). The take-profit target can be set at $4,746–$4,749 (4-hour and 1-hour upside pivot). This setup offers a risk-reward ratio of roughly 1:2.5. For those who prefer confirmation before entering, waiting for the gold price to break above $4,749 on the 1-hour chart and then retesting it as support would provide a higher-probability long entry. For traders seeking precise entry and exit points, professional gold trading signals can provide real-time alerts based on these exact levels.
Traders looking to own physical gold as a long-term store of value can purchase physical gold directly from SmartGoldTrade's certified inventory.
Key Takeaways
- Gold price holds at $4,748, above all major moving averages.
- Daily upside target: $4,857; daily downside support: $4,667.
- 4-hour resistance at $4,746; support at $4,703.
- RSI at 66.6 leaves room for further upside without overbought risk.
- Key event this week: US PPI on Thursday — could catalyse a move to $4,857 or $4,667.
- ATR of $16.70 suggests a daily range of ~$33; trade with tight stops in thin liquidity.
Conclusion
The gold price is in a clear bullish structure on the daily and 4-hour timeframes, supported by DXY weakness and bullish moving averages. The immediate resistance at $4,746–$4,749 is the key hurdle for Asian session bulls. A break above that zone could accelerate toward the $4,857 daily target. However, traders must respect the risk of a false move in low liquidity. Use the levels provided, manage risk with appropriate stop losses, and remain patient.
Frequently Asked Questions
- What is the current gold price?
- The gold price is $4,748.75 as of the Asian session open on May 12, 2026. This level is above the MA20 ($4,711), MA50 ($4,644), and MA200 ($4,679).
- What is the daily resistance for gold?
- The daily upside target from the pivot arrows is $4,857. The immediate 4-hour resistance is $4,746, and the 1-hour resistance is $4,749.
- What support levels should gold traders watch?
- Key supports are S1: $4,703 (4-hour downside pivot), S2: $4,667 (daily downside target), and the MA20: $4,711. A break below $4,667 would turn the trend bearish.
- How does the US Dollar affect gold price today?
- The DXY is near two-month lows, which is supportive for the gold price. A further decline in the dollar could push gold toward $4,857, while a dollar recovery could trigger a pullback to $4,667.
- What is the best entry strategy for gold right now?
- Look to buy near the $4,703–$4,711 zone with a stop at $4,690 and a target of $4,746–$4,749. This offers a favourable risk-reward ratio for the Asian session.
Trading Gold (XAU/USD) carries significant risk of loss and is not suitable for all investors. This content is for informational purposes only and does not constitute financial advice. Always conduct your own research and trade responsibly.