
The gold price is accelerating higher during Monday's American session, currently trading at $4,731.83 after last week's mixed risk-on flows. Despite a strong NFP beat that fueled equity rallies, gold has held its ground and is now testing a critical resistance zone. The question for traders is whether the bulls have enough momentum to clear the $4,746 hurdle or if a pullback is brewing. Let's break down the technicals and fundamentals shaping this session.
Gold Market Overview
Macro Context
The dollar index (DXY) remains under mild pressure after last week's non-farm payrolls report showed a headline beat, yet the market continues to price in a softer Fed stance. US Treasury yields edged lower, providing tailwinds for the gold price. The S&P 500 and Nasdaq rallied on the NFP number, but underlying non-confirmations in breadth and volume suggest the equity rally may be fragile. This divergence is keeping safe-haven demand alive for gold.
Session Outlook
With liquidity returning after the Asian and European sessions, the American session is poised for a decisive move. Key triggers include any headlines around Fed speakers, geopolitical tension escalation, or a sudden shift in risk sentiment. The $4,702–$4,746 range is the battleground. A breakout above $4,746 could open the door to the daily upside target of $4,857, while a failure may see a retest of $4,702 support.
Technical Analysis
Moving Average Structure
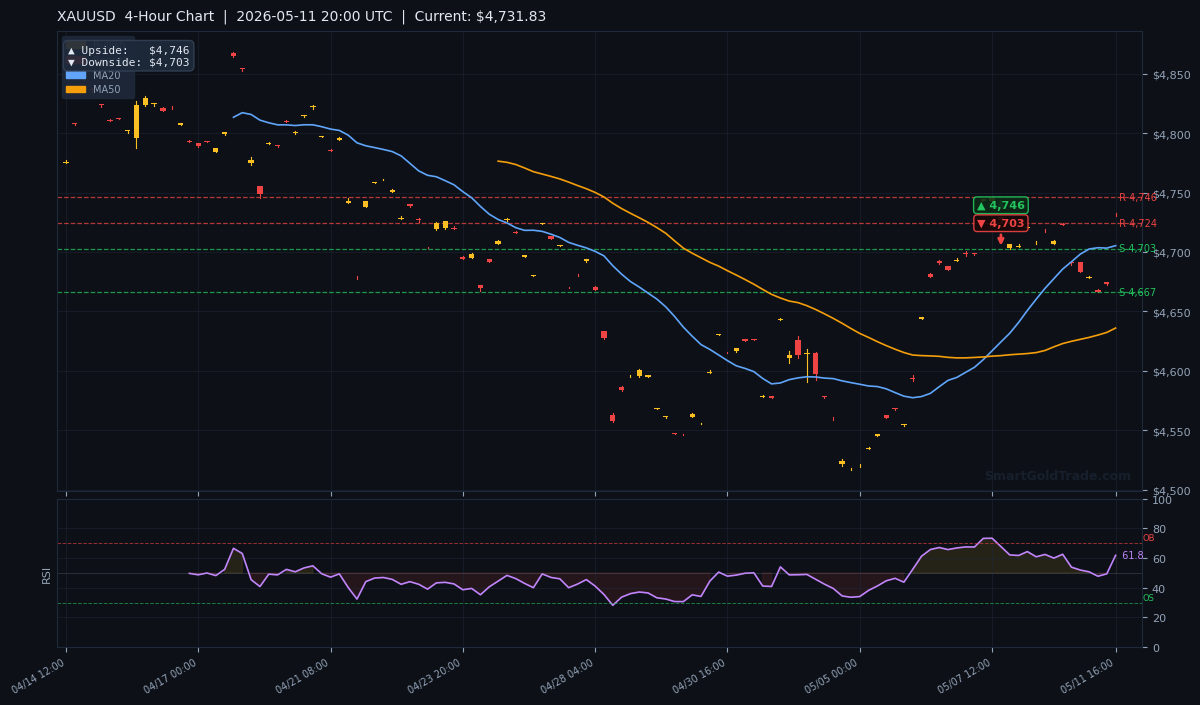
The short-term MA20 at $4,705.33 is well below the current price, confirming immediate bullish momentum. The MA50 at $4,636.06 and the MA200 at $4,676.98 are both lower, indicating a strong multi-timeframe bull market. The EMA structure (MA20 > MA50) reinforces short-term bullish momentum. The gold price is trading above all three key moving averages, a classic sign of trend strength.
RSI and Momentum
The RSI(14) sits at 61.8, squarely in neutral territory. This leaves plenty of room for further upside before reaching overbought levels above 70. The absence of divergences suggests the current move is supported by genuine buying pressure. Momentum indicators are aligned with price action, favoring continuation.
Key Price Levels
Support is firm at S1: $4,702.94 and S2: $4,666.72. Resistance stands at R1: $4,745.97 and R2: $4,724.42 (note: R2 is below R1 due to pivot calculation nuances — the immediate ceiling is R1 at $4,745.97). The ATR(14) of $17.32 implies a daily range of roughly $34, supporting moves toward either boundary. The current price action is compressing as it approaches resistance, hinting at an imminent breakout.
Fundamental Drivers
Last week's NFP beat (headline number strong) initially boosted equities, but the gold price refused to break down. This resilience suggests the market is more focused on the Fed's next move — a potential rate cut by late 2026 — than on a single jobs report. Additionally, geopolitical risks remain elevated, supporting safe-haven flows.
Key Event to Watch
This week, traders will watch for any Fed commentary, especially after the NFP data. A dovish tilt could push the dollar lower and accelerate gold's rally. The key is whether the $4,746 resistance holds or breaks. A close above that level on the daily chart would be a strong bullish signal.
Devil's Advocate
If the dollar suddenly strengthens on hawkish Fed talk or a risk-off event triggers a liquidity squeeze, the gold price could reverse. A break below $4,702 support would shift momentum bearish, with the next major support at $4,667. The RSI is neutral, so there's no protection from overbought conditions. Bulls need to defend $4,702 at all costs.
Trading Strategy for American Session
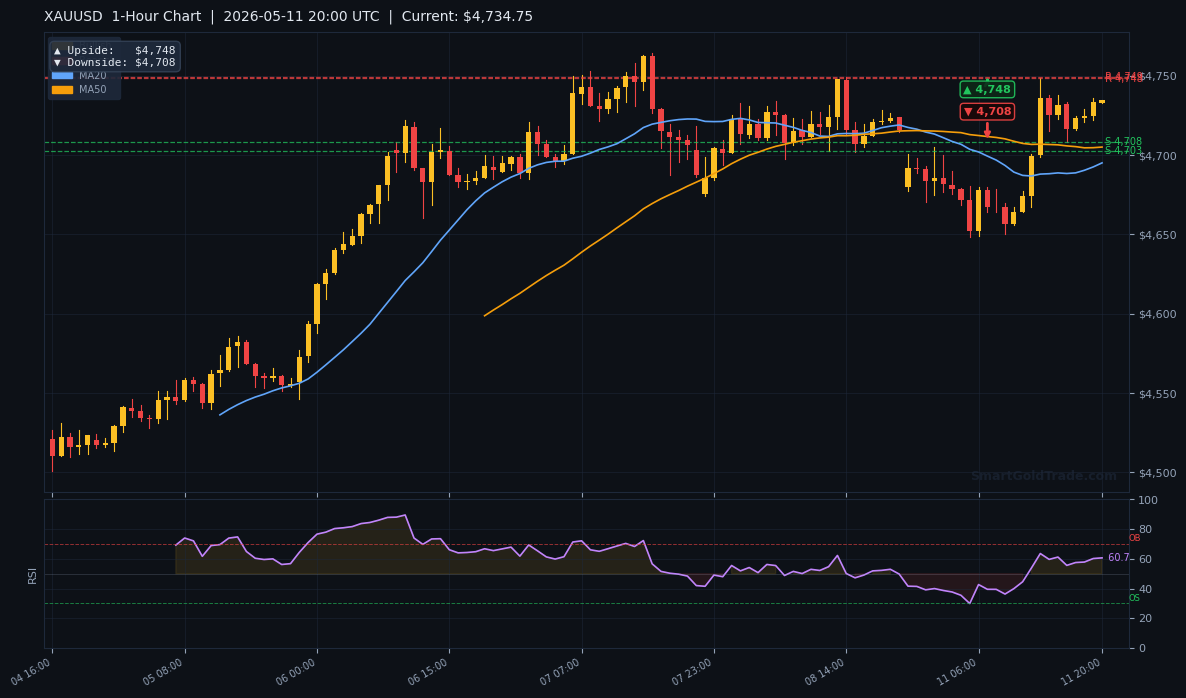
For aggressive bulls, look for a retest of the $4,702 support zone to enter long with a stop loss at $4,685 (just below the H1 support). Target $4,746 (R1) and then $4,857 (daily upside pivot). For a breakout play, wait for a confirmed 4-hour close above $4,746 with volume, then enter long targeting $4,800 (round number) with a stop at $4,720. For bears, only consider short if price fails at $4,746 and breaks below $4,702; then target $4,667 with a stop at $4,735. Traders looking for a hands-off approach can explore copy trading to mirror top gold professionals.
Key Takeaways
- The gold price is trading at $4,731.83, above all key moving averages.
- Immediate resistance at $4,746 (R1) — a breakout could lead to $4,857.
- Support sits at $4,702 (S1) and $4,667 (S2).
- RSI at 61.8 indicates room for further upside.
- ATR of $17.32 means daily swings of around $34 are normal.
- Last week's NFP beat failed to break gold's bullish structure — momentum remains intact.
Conclusion
The gold price is at a pivotal moment in the American session. With momentum accelerating and resistance at $4,746 in sight, bulls have the upper hand. The macro backdrop — dollar softness, geopolitical uncertainty, and a dovish Fed outlook — continues to support gold. A clean break above $4,746 would likely trigger a wave of buying toward $4,857 in the coming days. Failure to break, however, could see a temporary pullback to $4,702. Watch the close today for confirmation.
Frequently Asked Questions
- What is the gold price right now?
- As of the American session on May 11, 2026, the gold price is trading at $4,731.83 per troy ounce.
- What are the key support and resistance levels for gold today?
- Key support is at $4,702 and $4,667. Resistance is at $4,746 and then $4,857 on the daily chart.
- Is gold bullish or bearish right now?
- The technical structure is bullish — price is above all three major moving averages with RSI at 61.8, leaving room for upside. However, resistance at $4,746 must break for confirmation.
- What moved gold price during the Asian and European sessions?
- Gold held steady near $4,730 as markets digested the NFP data from last week. Dollar weakness and geopolitical jitters provided underlying support.
- How can I trade gold today?
- Watch for a breakout above $4,746 or a dip to $4,702. Use stop losses of around $17 (based on ATR) to manage risk. Consider copy trading for automated execution.
Trading Gold (XAU/USD) carries significant risk of loss and is not suitable for all investors. This content is for informational purposes only and does not constitute financial advice. Always conduct your own research and trade responsibly.