
Gold Price Market Overview
The gold price opened the European session at $4,678.62, hovering near a critical inflection point after last week’s rebound from geopolitical headlines. Despite a fleeting rally inspired by safe-haven flows, the underlying technical structure is flashing warning signs. The price remains below the short-term MA20 at $4,702.53, and bears are actively defending the $4,700 zone.
In the macro context, the US Dollar Index (DXY) is steady near 104.20 after last week’s selloff, while Treasury yields are edging higher, creating headwinds for non-yielding assets. The Federal Reserve’s neutral stance continues to cap speculative enthusiasm. Meanwhile, geopolitical tensions in the Middle East and Eastern Europe provide intermittent support, but the market is increasingly focusing on the technical breakdown risk.
Macro Context
The DXY is stabilizing after a sharp decline triggered by weaker-than-expected US jobs data released on May 8. That data, now past, fueled a brief spike in gold to $4,724 before sellers stepped in. The 10-year Treasury yield has risen 8 basis points this week to 4.35%, pressuring gold from a carry perspective. Traders are pricing in a 60% chance of a Fed rate cut in September, but near-term uncertainty keeps the market choppy.
Session Outlook
During the European session, liquidity is expected to be moderate to high as London desks open. The key trigger today is the release of Eurozone industrial production data (past event from April) and anticipation of US PPI figures due later this week (May 13). The range is likely to be contained between $4,667 and $4,703, with a bias toward the downside given the bearish short-term technicals. A break below $4,667 would open the path to $4,577, while a recovery above $4,703 could shift sentiment short-term.
Technical Analysis
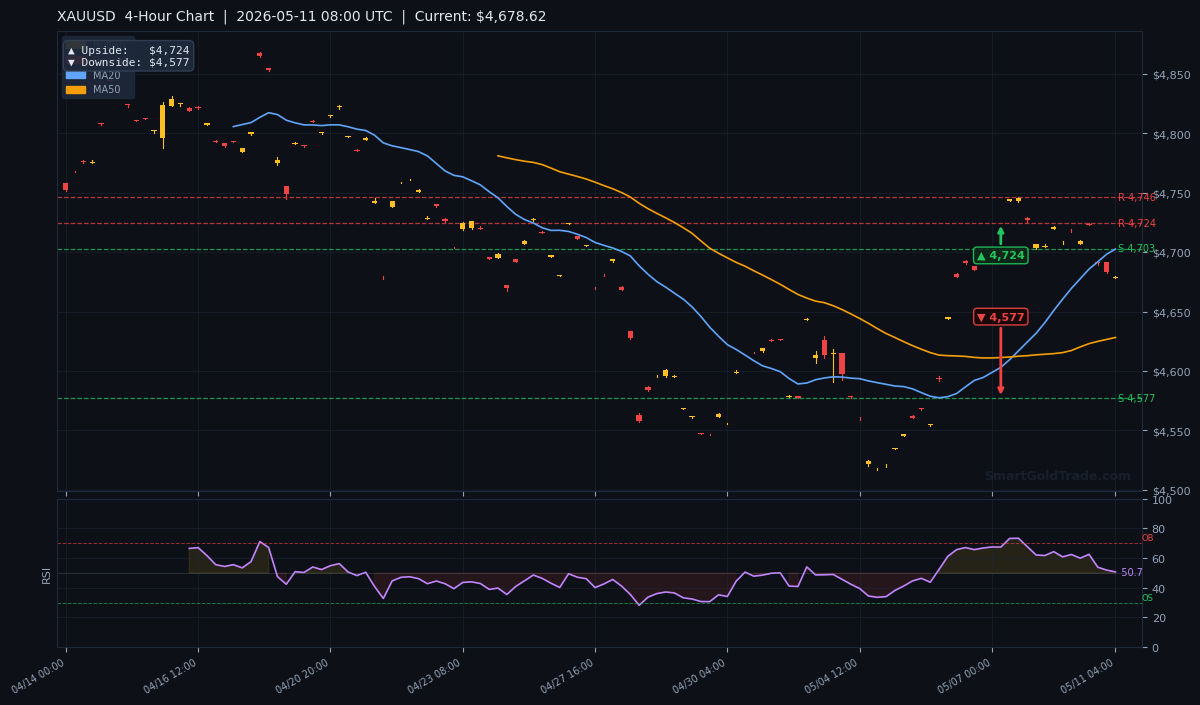
The technical picture on the 4-hour timeframe shows a market at a crossroads. The MA20 at $4,702.53 is acting as dynamic resistance, and the price is below it – a bearish short-term signal. However, the MA50 at $4,628.20 and the MA200 at $4,675.00 are both below the current price, confirming a longer-term uptrend. This creates a conflict between short-term weakness and medium-term bullish structure.
Moving Average Structure
The short-term trend is bearish as price trades below the MA20. The MA20 is above the MA50 (MA20 > MA50), which in theory suggests short-term bullish momentum – but the price actually being below the MA20 says the momentum is failing. The MA50 and MA200 remain in a bullish alignment, indicating the broader uptrend is intact. A close above $4,703 would restore short-term bullish momentum; a close below $4,667 would threaten the medium-term structure.
RSI and Momentum
The RSI(14) is at 50.7, right on the neutral line. This gives no directional bias and suggests the market is balanced – meaning the next impulsive move could be sharp. There is no overbought or oversold condition to reverse from. The ATR(14) is $15.36, implying a typical daily range of about $30. Today’s move could accelerate if the price breaks either side of the $4,667–$4,703 zone.
Key Price Levels
Support S1: $4,702.94 (minor level, but price is already below it – now acts as resistance)
Support S2: $4,577.37 (major support from 4-hour pivot)
Resistance R1: $4,745.97
Resistance R2: $4,724.42
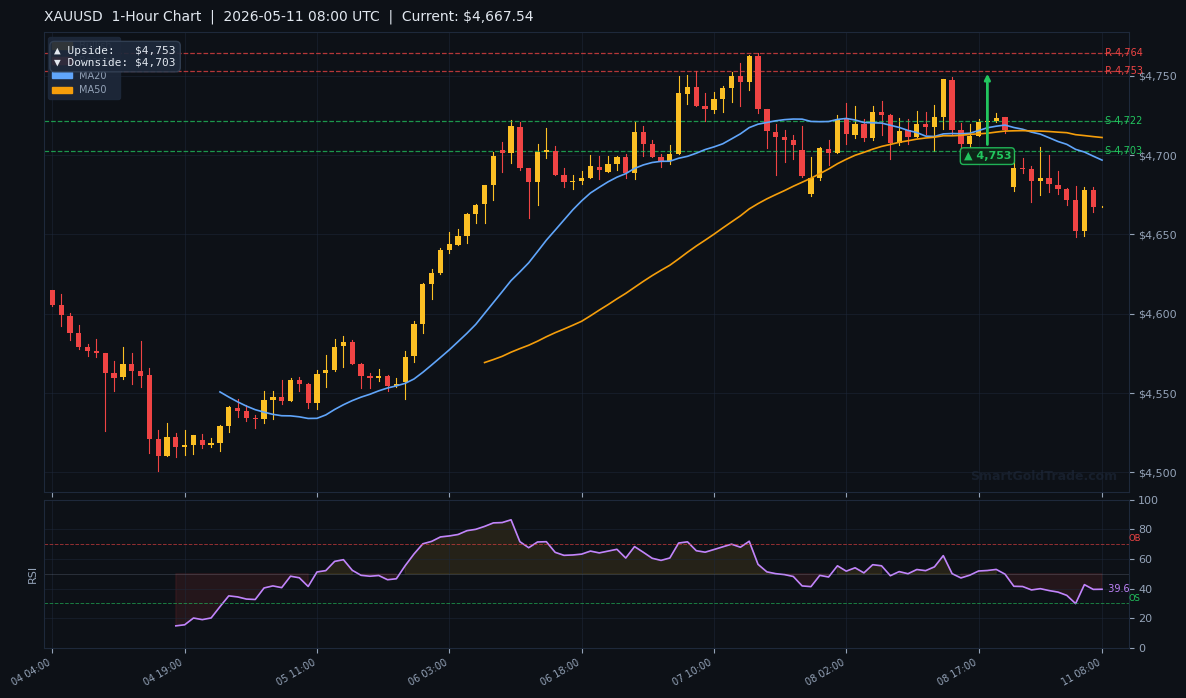
Based on the ATR, the expected trading range for this session is $4,663 to $4,694. The pivot arrow targets from the charts show daily downside target at $4,667 and 1-hour upside target at $4,753. The 4-hour target of $4,724 aligns with R2.
| Timeframe | Upside Target | Downside Target |
|---|---|---|
| Daily | $4,857 | $4,667 |
| 4-Hour | $4,724 | $4,577 |
| 1-Hour | $4,753 | $4,703 |
Fundamental Drivers
The recent rebound in gold was sparked by renewed geopolitical tensions over the weekend, with reports of drone strikes near critical energy infrastructure in the Middle East. That story is still developing, but the market has already priced in much of the risk. The real threat comes from two hidden factors: first, the potential for a stronger US dollar if the Fed signals a delayed rate cut; second, the rising opportunity cost of holding gold as yields climb.
In the source material, analysts warn not to 'rush to chase the highs' – precisely because the geopolitical storm may not be enough to sustain the rally if the macro tide turns. The correlation with the DXY remains strong; any upside surprise in US PPI on Thursday could send the dollar higher and gold lower.
Key Event to Watch
The most important upcoming event this week is the US Producer Price Index (PPI) for April, scheduled for May 13. If the data shows persistent inflation, the Fed will have less room to cut rates, pushing the dollar higher and likely breaking gold below $4,667. Conversely, a soft PPI could ignite a rally back toward $4,724. Watch the release closely.
Devil's Advocate
The main bullish bias could be invalidated if the price closes above $4,703 during the European session. That would flip the short-term structure from bearish to neutral and open the door to retest $4,724. However, the bearish case remains stronger as long as the price fails to reclaim the MA20. A break below $4,667 would confirm the reversal and likely accelerate selling toward $4,577.
What could flip the trade? A sudden ceasefire news or weaker-than-expected US economic data that reignites rate cut bets. But right now, the odds favor downside.
Trading Strategy for European Session
For aggressive traders, consider a short entry near $4,680–$4,685 with a stop loss above the MA20 at $4,710 (ATR-based buffer). The initial take-profit target is $4,667 (daily pivot downside), with a secondary target at $4,577 if bearish momentum builds. Risk management is key – the ATR of $15.36 means a stop of about $25 is reasonable.
For a long scenario, wait for a confirmed close above $4,703 on a 4-hour candle, then enter with a stop below $4,680. Target $4,724 then $4,745. However, given the current setup, the short bias is preferred. For those seeking a lower-risk approach, consider waiting for a retest of $4,667 before entering. Traders looking for more precise entry points may benefit from professional gold trading signals.
For long-term investors seeking exposure without leverage, halal gold trading offers a Shariah-compliant alternative with physical ownership.
Key Takeaways
- Gold price is trading at $4,678.62, below the MA20 ($4,702.53) – bearish short-term bias.
- RSI at 50.7 signals neutral momentum; the next break could be explosive.
- Immediate support lies at $4,667 (daily downside target) and then $4,577.
- Resistance is at $4,703 (MA20) and $4,724 (4-hour pivot).
- US PPI data on May 13 is the key fundamental catalyst this week.
- ATR of $15.36 indicates a potential daily range of approximately $30.
Conclusion
The gold price is at a pivotal juncture. While the medium-term trend remains bullish above the MA200, the short-term risk is tilted to the downside. Bears are testing the $4,667 support, and a break below could trigger a sharp move lower. Traders should brace for elevated volatility during the European session and avoid chasing the rally. The path of least resistance is lower unless buyers can reclaim $4,703. Stay alert for PPI later this week.
Frequently Asked Questions
- Is gold price going to break below $4,667 today?
- It is possible if the DXY strengthens and the $4,702 support fails. The technical setup shows neutral RSI but a bearish short-term momentum. Traders should watch the $4,667 level closely – a close below it could open a move to $4,577.
- What is the best entry level for gold right now?
- For shorts, an entry near $4,680–$4,685 with a stop at $4,710 is reasonable. For longs, wait for a confirmed break above $4,703 with volume. The risk-reward on short trades is better given the current structure.
- How does the US PPI affect gold price this week?
- US PPI (May 13) will influence Fed rate cut expectations. A hot number lifts the dollar and yields, pressuring gold toward $4,667 or below. A cold number could fuel a rally back toward $4,724.
- Should I buy physical gold or trade XAUUSD today?
- Physical gold is a long-term store of value, while XAUUSD trading is speculative and short-term. Given current volatility, traders may prefer short-term positions, but investors looking for a hedge can purchase physical gold without leverage risk. Always match your strategy to your risk tolerance.
Risk Disclaimer: Trading Gold (XAU/USD) carries significant risk of loss and is not suitable for all investors. This content is for informational purposes only and does not constitute financial advice. Always conduct your own research and trade responsibly.