Gold price at $4,046.49 begins the Asian session recovering from a fresh dip to $4,013.47, as thin liquidity keeps large players on the sidelines. Yesterday’s Australian employment report gave the Aussie dollar a lift, pressuring the US dollar slightly, yet gold failed to hold above the key $4,063 pivot. The intraday bounce risks trapping late bulls, as the 4-hour chart remains decidedly bearish with price buried below the 20, 50, and 200-period moving averages. With the Middle East situation still simmering, any sudden flight to safety could spark a quick rally, but traders should not chase such moves in low volume. The central question today: can gold reclaim $4,063, or will sellers push the metal towards $4,013 and possibly $4,000?
Gold Price Today: Session Overview
Macro Context
The US dollar index (DXY) remains elevated near 105.50, keeping the pressure on dollar-denominated gold. Although yesterday’s Australian employment data signalled a tight labour market, it did little to crack the greenback’s dominance. US 10-year Treasury yields steadied around 4.05%, reflecting a market that is still pricing in a resilient US economy. Fed officials have maintained a hawkish lean, with the next FOMC meeting weeks away.
Session Outlook
Asian session liquidity is thin, with Tokyo and Singapore markets open but without major data releases. Gold typically trades within a narrow range during these hours, but sharp moves can occur if sentiment shifts. Today, expect gold to oscillate between the $4,040 and $4,063 region, with the low $4,013 serving as a floor. A break below would target the $4,000 psychological level.
Gold Price Technical Analysis
Moving Average Structure
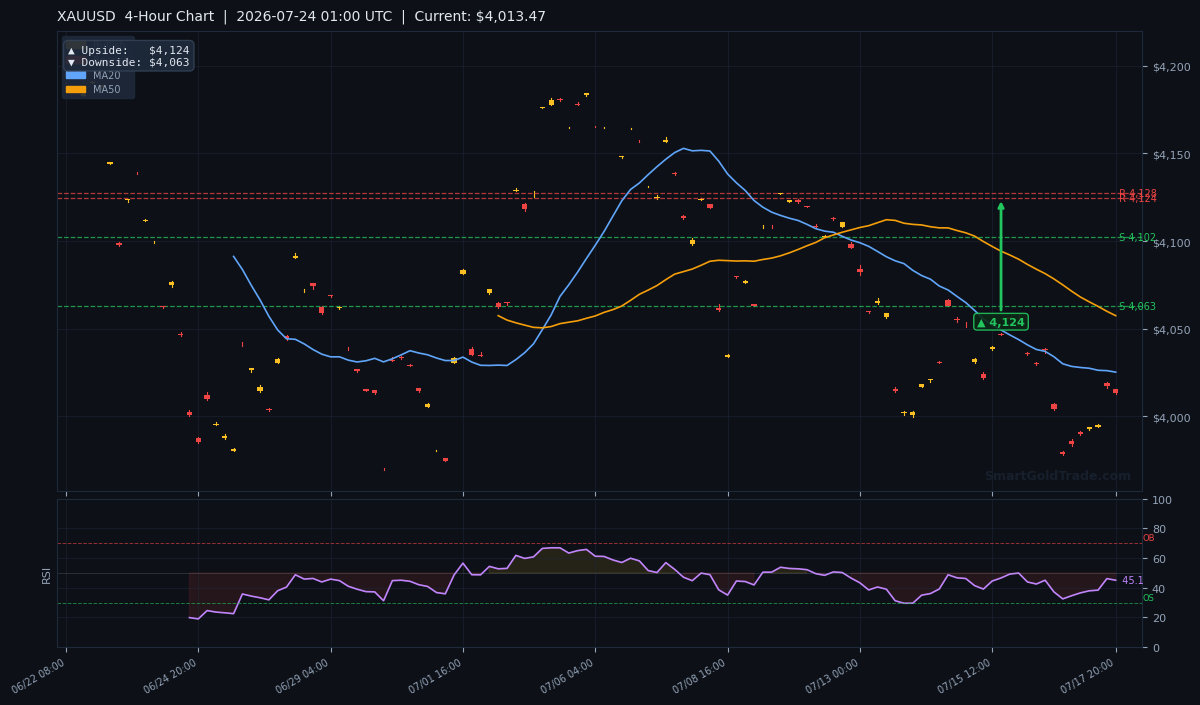
The 4-hour chart shows the price at $4,013.47—a snapshot that reflects the dip before the mild recovery. The 20-period MA at $4,025.26 and the 50-period MA at $4,057.47 both sit above the current price, forming a descending slope. More alarmingly, the 200-period MA rests at $4,159.27, far overhead. The bearish alignment of MA20 below MA50 confirms short-term downward momentum. Even with the bounce to $4,046.49, the overarching moving average structure is bearish.
RSI and Momentum
The Relative Strength Index (RSI) on the 4-hour timeframe reads 45.1, sitting in neutral territory. This reading suggests neither oversold nor overbought conditions, leaving room for a continuation of the prior trend. With RSI below 50 and tilted downward, momentum leans in favour of sellers. No bullish divergence has formed yet, keeping the bias negative.
Volume and Gold Price Sensitivity
During thin Asian liquidity, gold price movements often amplify even modest order flow. The current session exhibits below-average volume, which can lead to erratic spikes that trap unsuspecting traders. Watching how price reacts around the $4,063 resistance zone will be crucial. A sharp rejection there would confirm that sellers remain in control, while a slow grind higher on declining volume could signal a false breakout. Prudent traders will let the first hour of the session settle before committing to a direction, avoiding the noise that often accompanies low‑volume gold price swings.
Key Price Levels
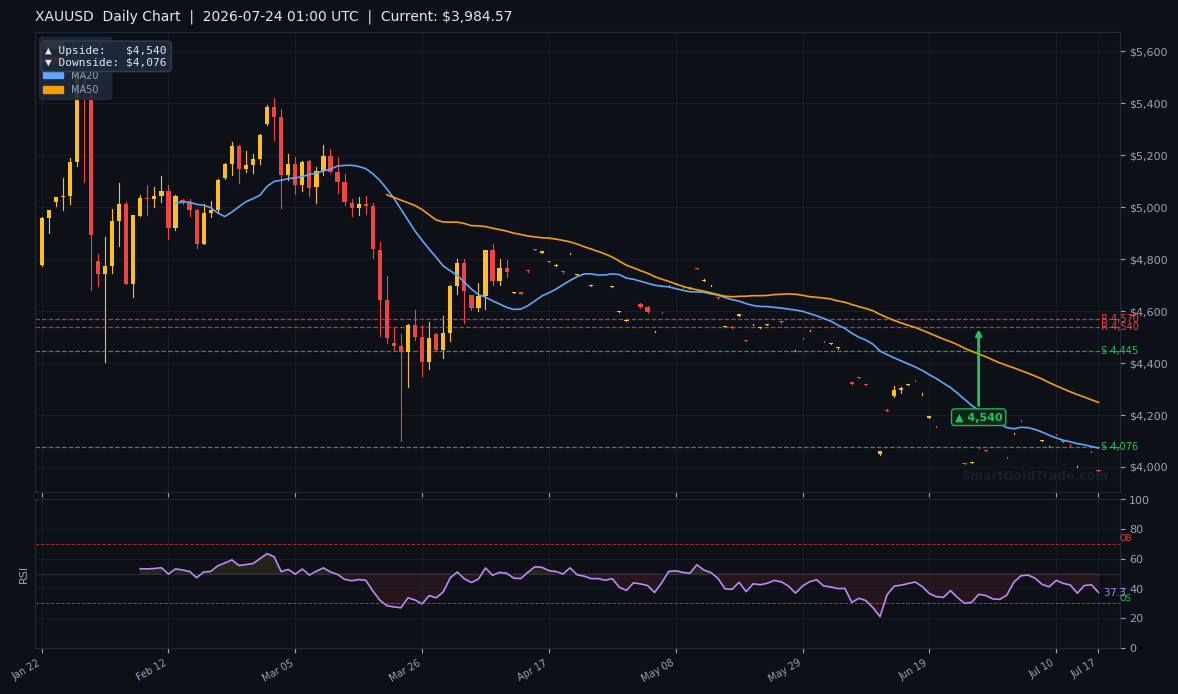
Support S1 stands at $4,147.61, and S2 at $4,124.26. Resistance R1 is at $4,164.23, with R2 at $4,159.15. However, these levels are based on a higher price range; after the breakdown, the former support at $4,063 (the 4-hour downside pivot) now acts as near-term resistance. The Average True Range (ATR) of $12.14 implies a daily volatility of roughly $24 on a full-day move, though Asian sessions typically see half that range.
| Timeframe | Upside Target | Downside Target |
|---|---|---|
| Daily | $4,540 | $4,076 |
| 4-Hour | $4,124 | $4,063 |
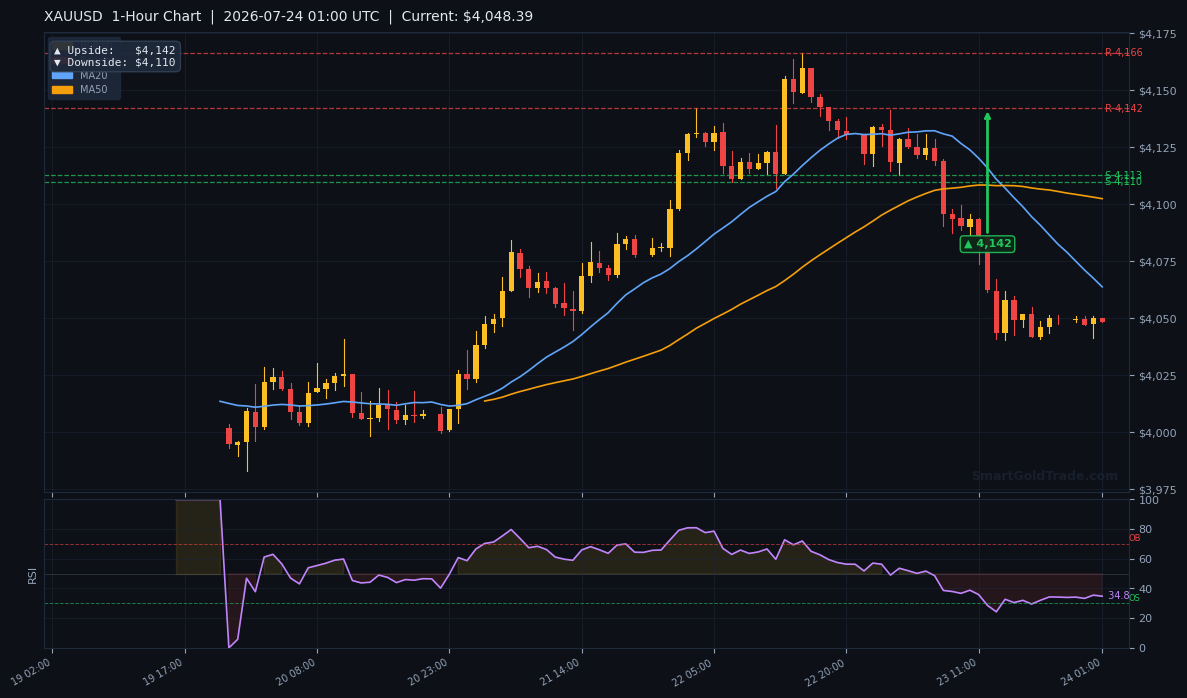
| 1-Hour | $4,142 | $4,110 |
Fundamental Drivers
Yesterday’s Australian jobs report showed an addition of 35,000 positions, beating expectations and lifting the Australian dollar to 0.7010. This slightly pressured the US dollar, yet gold’s reaction was muted, indicating underlying bearish sentiment. The Middle East remains a wildcard, with geopolitical tensions capable of sparking safe-haven demand. However, in the current environment, the metal has struggled to capitalise on such fears. For long-term investors looking to shield against currency erosion, purchasing physical gold coins and bars from a trusted source can provide a tangible hedge.
Key Event to Watch
Traders now look ahead to next week’s US GDP and PCE inflation data, which could reshape rate expectations. A hot inflation reading would strengthen the dollar and push gold lower; a miss could relieve some pressure. Until then, the quiet calendar leaves gold at the mercy of technical flows and any sudden geopolitical headlines.
Devil's Advocate
The bearish thesis hinges on price staying below $4,063. A rally that breaches $4,124—the 4-hour resistance pivot—would invalidate the immediate downside bias. If gold powers through $4,124, the next target becomes $4,142, and the RSI could shift bullish. Such a break would likely require a sudden geopolitical escalation or a sharp drop in the dollar.
Trading Strategy for Asian Session
Use a cautious approach. Enter short on a retest of $4,063 with a stop loss above $4,124, around $4,130. This gives a risk of about $67 per ounce. Take-profit targets: first at $4,040, second at $4,013. The ATR of $12.14 supports this range. Avoid chasing breakouts in thin liquidity. Alternatively, aggressive traders could sell near $4,050 with a tighter stop. No matter the gold price action during the session, halal traders benefit from zero-swap execution that keeps positions free of overnight interest. For those seeking real-time entry points, professional gold trading signals can help navigate the quiet hours.
Why Today's Gold Price Matters for Halal Investors
For Shariah-compliant market participants, every gold price fluctuation must be traded within an interest‑free framework. Leveraged products and overnight swap fees—common in conventional brokerages—contravene Islamic principles. That’s why many turn to spot gold ownership, where you hold a real asset and avoid riba. At $4,046.49, the current gold price offers both short‑term tactical entries and long‑term accumulation opportunities, but only if the platform itself is structured correctly.
SmartGoldTrade’s halal gold trading delivers exactly that: physical ownership with fractional lots, no leverage, and no overnight swaps. Whether the gold price dips towards $4,013 or rallies through $4,124, you can act on your analysis without worrying about hidden interest charges. This makes it easier to abide by Quranic guidance on trade while still capturing moves in the world’s oldest store of value.
Key Takeaways
- Gold oscillates around $4,046.49, with immediate resistance at the broken support $4,063.
- The 4-hour chart shows a bearish MA alignment; price remains below the 20, 50, and 200-MA.
- RSI at 45.1 points to neutral momentum with a mild downside bias.
- Key downside targets: $4,040 and $4,013; a drop below $4,000 could intensify selling.
- A decisive break above $4,124 would shift the bias to bullish, targeting $4,142.
- The Asian session range likely stays tight, around $4,040–$4,063.
Conclusion
Gold’s technical picture remains fragile as the Asian session begins. The failure to reclaim $4,063 keeps the path of least resistance lower. With the US dollar sturdy and liquidity thin, a drift toward $4,040 and a retest of $4,013 are likely scenarios. Only a bounce above $4,124 would rewrite the script. Traders should stay patient, stick to well-defined risk parameters, and avoid impulsive entries during these quiet hours.
FAQ
- What is the gold price forecast for the Asian session on July 24, 2026?
- Gold price is expected to trade bearishly, with resistance at $4,063 and support at $4,013. A break below $4,013 could open $4,000, while a move above $4,124 would flip the bias to bullish.
- What are the key support and resistance levels for gold price today?
- Immediate resistance sits at $4,063 (former 4-hour pivot). Strong resistance at $4,124. Support holds at $4,040 and $4,013. The daily chart places longer-term support at $4,076.
- How does the gold price affect halal trading?
- For Shariah-compliant traders, gold price movements must be navigated without leverage or swaps. Using a halal gold trading platform ensures interest-free spot trading, allowing you to benefit from price swings in a riba-free manner.
Trading Gold (XAU/USD) carries significant risk of loss and is not suitable for all investors. This content is for informational purposes only and does not constitute financial advice. Always conduct your own research and trade responsibly.