
Gold price dropped to $4,477.66 early in the American session after a hotter-than-expected ADP employment report sent the dollar ripping higher. Private payrolls jumped 220k in May, smashing the 180k consensus, and the DXY spiked above 104.50 within minutes of the release. The move shoved gold through the 20-period moving average at $4,481.96 and has traders watching the $4,474 downside target from the 1-hour and 4-hour charts. With ISM Services data still ahead, this session could turn into a liquidity-driven breakout — and the bears have the momentum.
Gold Market Overview
Macro Context
Demand for the greenback is ruling the tape this afternoon. The US 10-year yield climbed back above 4.45% after the ADP print, reinforcing the classic inverse correlation between real rates and gold. While emerging-market inflation fears — like the Philippines scenario where DBS flags food and currency-driven price pressure — keep a bid under physical bullion, the short-term driver in New York is overwhelmingly the strength of the dollar.
Geopolitical headlines remain quiet for now. No fresh energy crisis or military escalation is crossing the wires, so gold’s safe-haven premium is shrinking. The Fed funds futures curve still prices the next rate cut in September, but a run of strong data this week could push that out to November. That rate repricing is exactly what’s pressuring the yellow metal today.
Session Outlook
The American session is where volume explodes. After the ADP reaction, traders will pivot quickly to the ISM Services PMI at 10:00 AM ET. A print above 50.5 would likely send yields higher and push the gold price toward $4,474 within the hour. Liquidity is deep, but that also means technical levels break cleanly — stops cluster below $4,475 and a sweep could accelerate the move.
I expect a range of roughly $4,460 to $4,520 today, using the average true range (ATR) of $18.26 as the baseline. If ISM surprises to the downside, gold could stage a rapid short-covering rally back toward $4,508. But the path of least resistance, given the moving-average structure, is lower.
Technical Analysis
Moving Average Structure
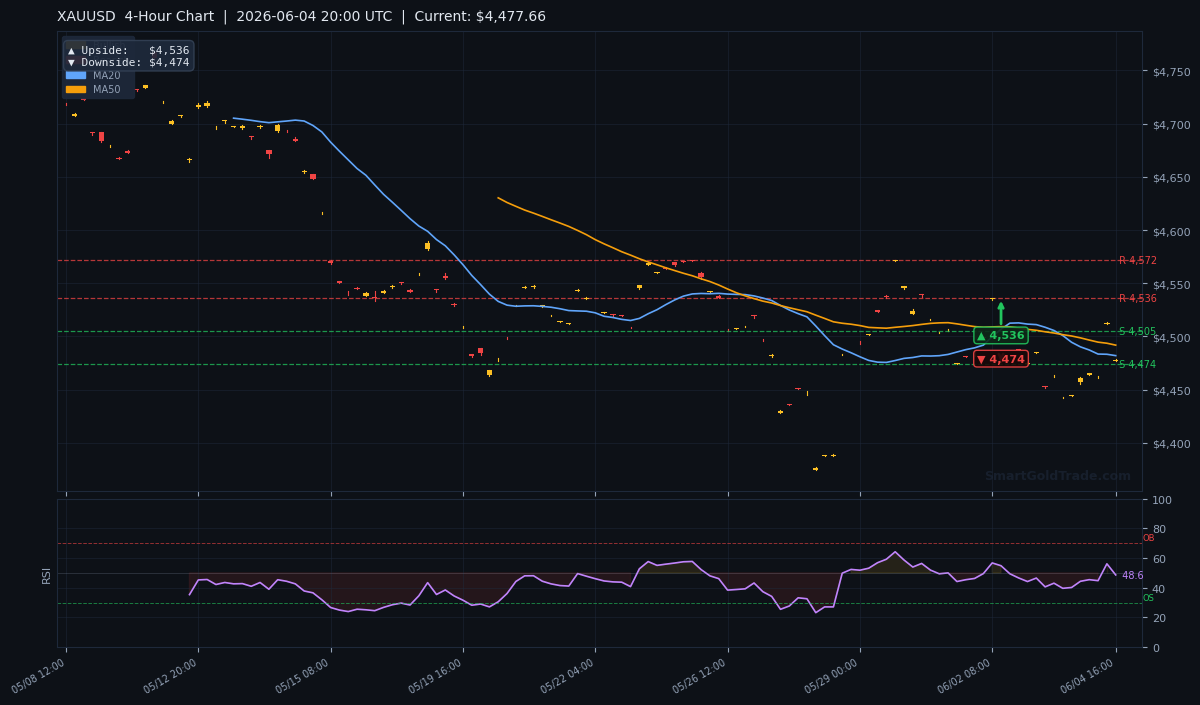
The price is trading below all three major moving averages, and the EMA structure confirms short-term bearish pressure with MA20 < MA50. Specifically, the 20-period moving average sits at $4,481.96, the 50-period MA at $4,491.83, and the 200-period MA way up at $4,594.98. This ladder of resistance means any bounce will struggle to clear $4,492 unless a fundamental catalyst flips sentiment.
The gold price hasn’t traded above the 200-MA since mid-May, so the medium-term trend is decidedly negative. As long as we stay under $4,482, the bears own the intraday flow and swing traders will be adding to shorts on retests of that zone.
RSI and Momentum
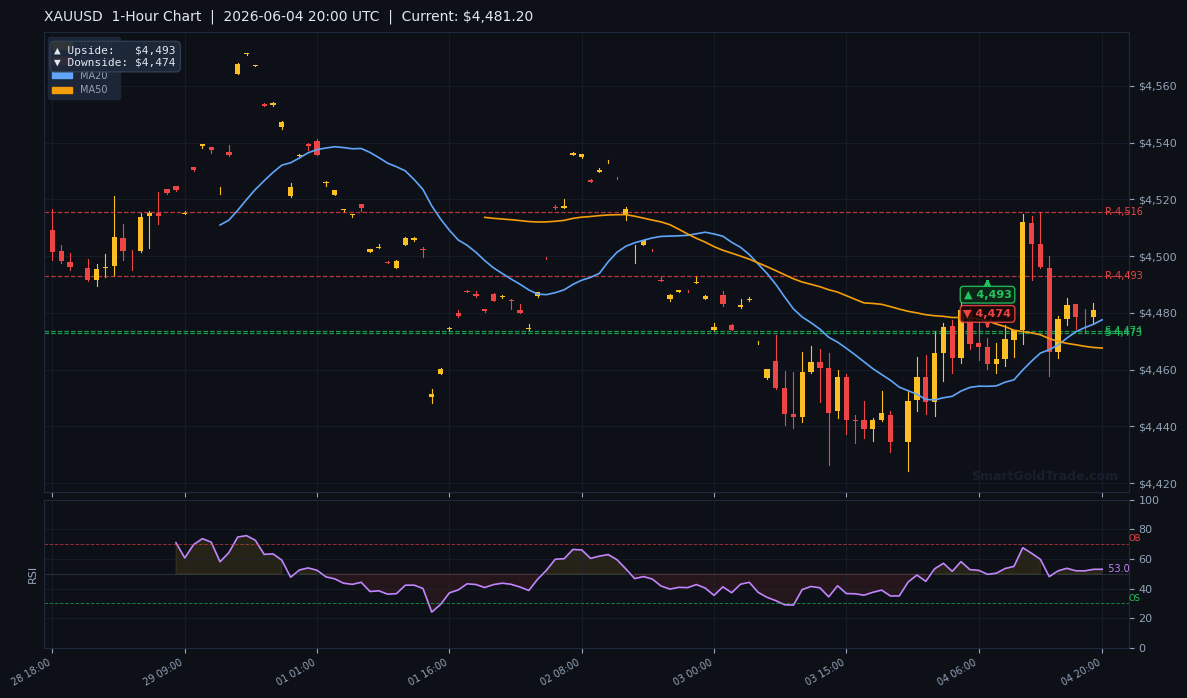
The RSI(14) reads 48.6, smack in neutral territory. That’s a problem for bulls because it signals no oversold condition to spark a mechanical bounce. Sellers can keep leaning on price without fear of an imminent RSI-oversold snapback. If the RSI drops below 40 during the session, it would confirm accelerating downside momentum and target the $4,474 horizontal level.
Key Price Levels
Today’s critical floor is $4,474 — the 1-hour and 4-hour downside objective marked by the pivot arrows on both timeframes. A daily close below that opens the door to the daily downside target at $4,667. On the upside, the former support zone at $4,505–$4,508 now acts as formidable resistance, reinforced by S1 at $4,507.87 and S2 at $4,505.38. The next resistance cluster sits at $4,571.58–$4,571.76 (R2 and R1), which will only come into play on a major sentiment shift.
Using the ATR(14) of $18.26, the expected intraday range extends from roughly $4,459 to $4,496. A break of either boundary would represent a >1-ATR expansion, typically a signal to hold winners and add to positions rather than fade the move.
| Timeframe | Upside Target | Downside Target |
|---|---|---|
| Daily | $4,823 | $4,667 |
| 4-Hour | $4,536 | $4,474 |
| 1-Hour | $4,493 | $4,474 |
Fundamental Drivers
The catalyst this morning was all about US labor-market strength. The ADP beat kicked the dollar into high gear, but traders are now parsing the run-up to Friday’s nonfarm payrolls. If Thursday’s jobless claims and Friday’s NFP reinforce the narrative of a resilient labour market, the gold price could lose another $50–$70 before the weekend because rate-cut expectations would get gutted.
Across the Pacific, emerging-market inflation stories like the Philippines — where DBS’s Radhika Rao warned that food, fuel, and a weak peso could push CPI well above the BSP target — are supportive for gold in the long run. But right now, that structural bid is being drowned out by a muscular dollar and positive real rates on US paper.
Key Event to Watch
The ISM Services PMI, dropping at 10:00 AM ET, is the single most important data point left this week before NFP. Services have been the sticky part of US inflation, and a reading above 51 will reinforce the “higher for longer” Fed thesis. I expect a knee-jerk drop toward $4,474 on a strong print, with potential to test $4,460 if the prices-paid sub-index spikes.
Devil’s Advocate
A bearish setup works until it doesn’t. If the gold price regains and closes above the $4,505–$4,508 resistance zone — the former support floor — the entire short bias unravels. A 1-hour candle close above $4,508 would trap late sellers and force a scramble toward the $4,536 4-hour upside target.
Similarly, a weak ISM Services print that sends the DXY below 104.00 would likely trigger a rapid short-covering rally. In that scenario, the MA20 at $4,481.96 becomes a springboard rather than a ceiling. Bulls would then target $4,493 and potentially $4,508 within the same session.
Trading Strategy for American Session
I’m looking to sell intraday rallies that stall near the fallen moving averages. The optimal entry zone is $4,485–$4,490, right under the MA20 ($4,481.96) and MA50 ($4,491.83). Place a tight stop loss at $4,510, just above the $4,508 double-top resistance and the ATR-based safety margin. That gives a risk of roughly $25 per ounce.
Set your first profit target at $4,474 — the 1-hour and 4-hour pivot low. If momentum stays strong, trail the stop to breakeven and aim for the $4,460 round number, which aligns with the lower edge of the expected daily range. A secondary target could be $4,440 if the ISM numbers are exceptionally strong.
For traders who don’t want to sit through the ISM volatility, consider reducing position size by half ahead of the release. Alternatively, copy trading lets you mirror top gold traders who navigate these data events daily without second-guessing entries. Using professional gold trading signals can also pinpoint exact levels as they develop, taking the guesswork out of breakouts.
Key Takeaways
- Gold price is under heavy bearish pressure, trading below all key moving averages at $4,477.66.
- The $4,474 level is the make-or-break support; a breakdown targets the daily pivot at $4,667.
- Resistance at $4,505–$4,508 must hold for sellers to stay in control.
- RSI at 48.6 leaves room for further downside before oversold signals appear.
- ADP employment beat lifted the dollar; ISM Services will dictate the afternoon move.
- Intraday expected range spans $4,459–$4,496 based on ATR of $18.26.
Conclusion
The American session has thrown a clear bearish signal. The gold price slipped below the $4,482 short-term anchor and now has a clear path toward the $4,474 1-hour and 4-hour downside objective. Unless the ISM data prints notably soft, any bounce will likely be sold into. I’m watching $4,508 as the line-in-the-sand — if price rejects that area, the afternoon risk is a sustained sell-off that could stretch below $4,460. The next 72 hours are all about the US economic calendar; until then, the bears have the wheel.
Frequently Asked Questions
- What is the key support level for gold today?
- The immediate support is $4,474, a level highlighted on both the 1-hour and 4-hour charts. A sustained break below that exposes the daily downside target at $4,667.
- Why did gold drop during the American session?
- A stronger-than-expected ADP employment report (220k vs 180k expected) boosted the US dollar and Treasury yields, triggering a sell-off that pushed gold below the $4,482 moving average.
- Where should I set a stop loss if I’m short gold?
- A logical stop sits above the $4,505–$4,508 resistance zone. I recommend $4,510 to account for the ATR of $18.26 and avoid being wicked out by a routine retest.
- What could flip the bearish bias this session?
- A 1-hour close above $4,508 would invalidate the downtrend and likely force a rally toward the $4,536 4-hour upside target. A weak ISM Services PMI print could also spark a sharp short-covering bounce.
- Is the daily trend still bearish for gold?
- Yes. The price remains well below the 200-period moving average at $4,594.98, and the moving average structure is in a bearish alignment. Only a push back above $4,595 would challenge the larger downtrend.
Risk Disclaimer: Trading Gold (XAU/USD) carries significant risk of loss and is not suitable for all investors. This content is for informational purposes only and does not constitute financial advice. Always conduct your own research and trade responsibly.