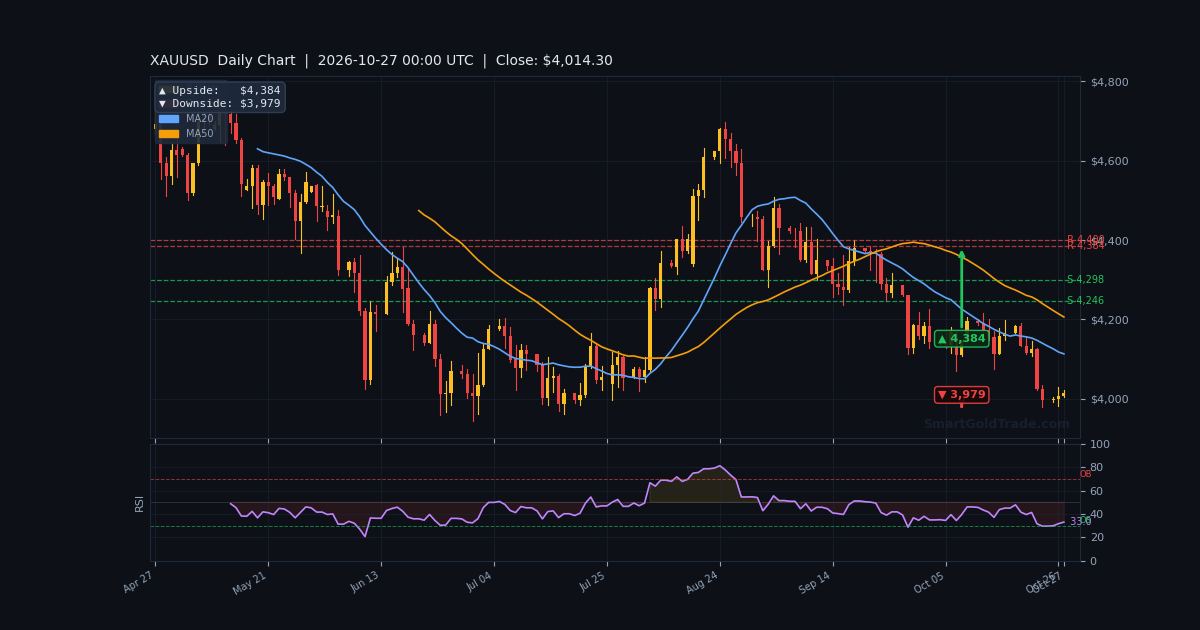
The gold price is holding near $4,009.90 in early Asian trading, a modest recovery after two straight losing sessions. The metal found buyers above the psychological $4,000 handle as easing oil prices cooled inflation fears. This week's Fed meeting on Wednesday dominates the calendar, and traders are reluctant to commit size ahead of the verdict. Liquidity is thin and ranges are compressed. Prepare for a quiet session, not a trending one.
Gold Market Overview
Macro Context
The dollar index remains firm as markets position for a hold from the Federal Reserve on Wednesday. The CME FedWatch tool shows only a 10% probability of a hike this week, though nearly 82% expect at least one more increase by year-end. That gap keeps the dollar supported and caps gold rallies.
Treasury yields are steady, offering no fresh catalyst for bullion. Geopolitical risk has eased slightly after Saudi Arabia's defense minister held talks with Iranian leaders in Tehran on Monday. Lower oil prices reduced the inflation-hedge bid for gold, though the reprieve may be temporary.
Session Outlook
The Asian session should stay range-bound between $4,009.60 and $4,026.30. Volume is light, and institutional desks are waiting for Wednesday's Fed statement and Chair Kevin Warsh's press conference. Do not chase moves in this tape. Low-volume breakouts often reverse within hours.
Watch the first hour for a liquidity sweep of either boundary. A clean hold above $4,026.30 on rising volume would be the first sign of genuine buying interest.
Technical Analysis
Moving Average Structure
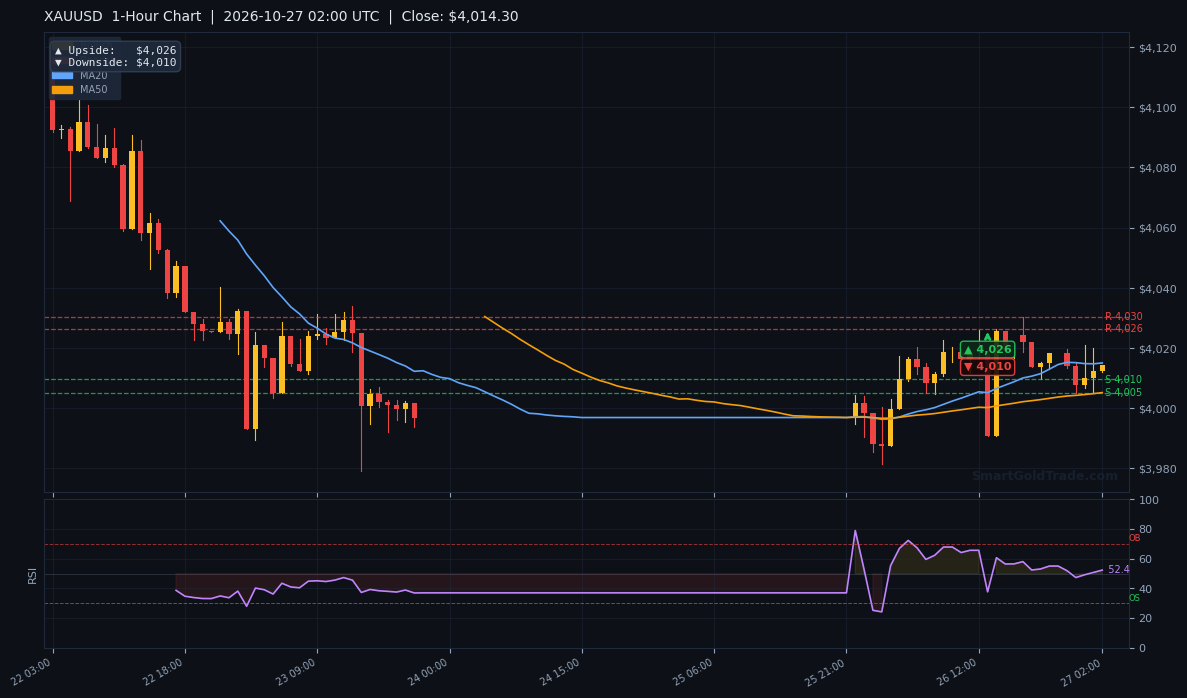
The MA20 sits at $4,014.82 and the MA50 at $4,005.10. The 20-period average is above the 50-period, confirming a bullish short-term structure. Price is trading just below the MA20, which is normal consolidation after a recovery leg.
A sustained reclaim of the MA20 would put the bulls back in control. A close below the MA50 would flip the bias.
RSI and Momentum
The RSI(14) reads 49.0, squarely in neutral territory. There is no overbought or oversold signal. This is a wait-and-see reading, typical of a market digesting a move before a major event.
Momentum traders should wait for RSI to break above 60 or below 40 before committing to a directional trade.
Key Price Levels
Support rests at $4,009.60 (S1) and $4,005.20 (S2). Resistance sits at $4,026.30 (R1) and $4,030.30 (R2). The ATR(14) is $11.66, or 0.29% of price, implying a session range of roughly $11 around the current level.
| Timeframe | Upside Target | Downside Target |
|---|---|---|
| Daily | $4,384 | $3,979 |
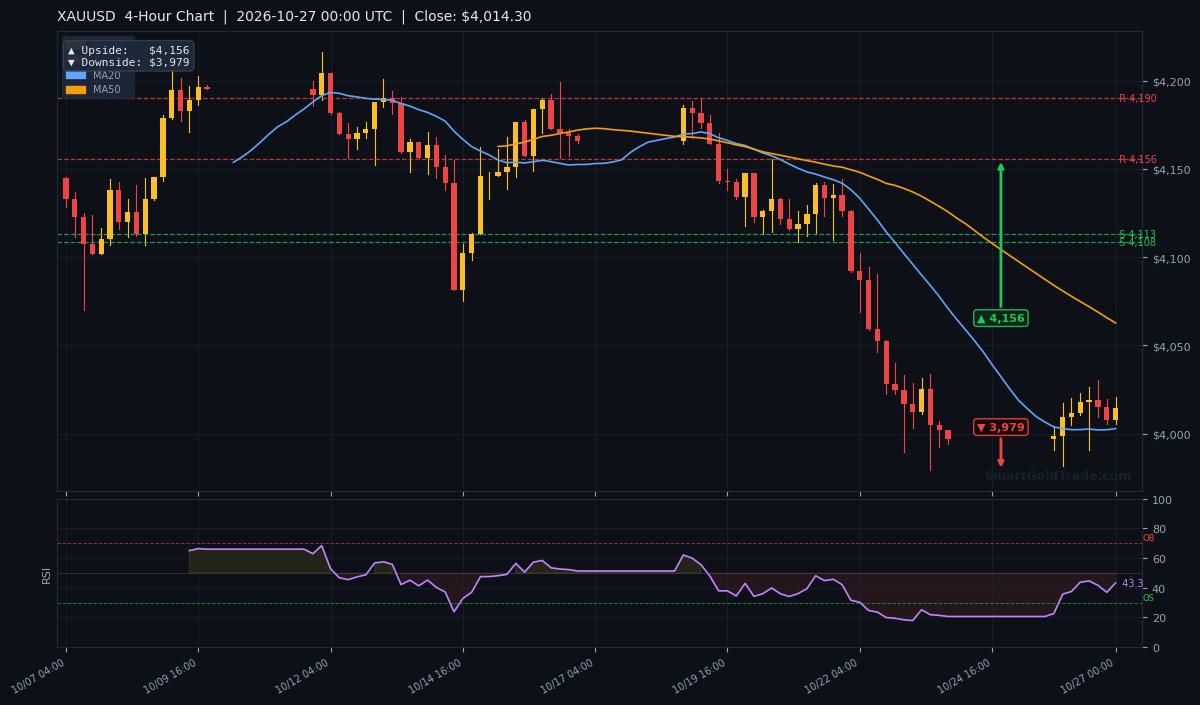
| 4-Hour | $4,156 | $3,979 |
| 1-Hour | $4,026 | $4,010 |
Fundamental Drivers
Oil prices tumbled after Saudi Arabia's defense minister met Iranian leaders in Tehran on Monday, easing fears of a wider conflict. Lower crude reduces inflation pressure, which trims gold's safe-haven appeal in the near term. StoneX strategist Bob Haberkorn noted the pullback in crude is helping gold, alongside some bargain hunting.
TD Securities reports that CTAs are now short across all momentum signals, with systematic funds heavy sellers. The bank notes CTAs would start covering shorts north of $4,092, which could trigger a sharp squeeze if reached.
Key Event to Watch
Wednesday's FOMC decision is the week's dominant event. A hold is fully priced, so the reaction will hinge on Chair Warsh's tone. A hawkish signal on year-end hikes would pressure gold toward $4,005. A dovish tilt could spark a rally toward $4,030.
Devil's Advocate
The bullish bias could fail if price closes below the MA50 at $4,005.10. That would invalidate the short-term uptrend and open the door to $3,979, the daily downside target. A break of S2 at $4,005.20 on strong volume would confirm the flip.
Conversely, if CTAs begin covering shorts above $4,092, the move could overshoot the R2 resistance quickly. Watch positioning data for clues.
Trading Strategy for Asian Session
Given thin liquidity, favor a patient approach. The primary setup is a long entry near $4,009.60 (S1) with a stop below S2 at $4,003.00, risking roughly $6.60. Target R1 at $4,026.30 for a 2.5:1 reward-to-risk ratio.
Alternatively, a short entry below $4,009.60 with a stop above $4,015.50 targets S2 at $4,005.20. Keep position size small; ATR of $11.66 means stops can be hit in noise.
Do not chase a breakout above R1 without volume confirmation. For those who prefer automated execution, a news event trading protection tool can pause trades during Wednesday's Fed announcement.
Investors seeking physical exposure can purchase physical gold as a longer-term hedge, but trading this session requires discipline. For those who want to build a position without the stress of intraday timing, Shariah-compliant gold investment pools offer a different route.
Key Takeaways
- Gold price holds $4,009.90, recovering above the $4,000 handle.
- MA20 at $4,014.82 above MA50 at $4,005.10 confirms bullish structure.
- RSI at 49.0 is neutral — no overbought or oversold signal.
- Key support at $4,009.60; resistance at $4,026.30.
- ATR of $11.66 implies a tight session range; avoid chasing breakouts.
- Wednesday's FOMC decision is the week's dominant catalyst.
Conclusion
The gold price is in a holding pattern near $4,009.90, with the bullish MA structure intact but momentum neutral. Thin Asian liquidity argues for patience, not aggression. The $4,009.60 support and $4,026.30 resistance define the session's battle lines.
Wednesday's Fed decision will likely decide the next directional leg. Until then, trade small, respect the range, and let the market show its hand.
FAQ
What is the gold price right now?
The gold price is $4,009.90 per ounce in early Asian trading on October 27, 2026.
What are the key support and resistance levels for gold today?
Support sits at $4,009.60 and $4,005.20. Resistance is at $4,026.30 and $4,030.30.
Is gold bullish or bearish right now?
The short-term bias is mildly bullish because the MA20 at $4,014.82 is above the MA50 at $4,005.10. However, RSI at 49.0 is neutral, so conviction is low.
What event will move gold this week?
Wednesday's FOMC decision is the key event. A hawkish tone could push gold toward $4,005, while a dovish signal could lift it toward $4,030.
Trading Gold (XAU/USD) carries significant risk of loss and is not suitable for all investors. This content is for informational purposes only and does not constitute financial advice. Always conduct your own research and trade responsibly.