The gold price is holding $4,287.82 in early Asian trading, pinned directly beneath R1 resistance at $4,288.56 after a modest +0.30% daily gain. Last week's hawkish shift from Philadelphia Fed President Anna Paulson, who flagged that inflation 'needs attention,' continues to cap upside momentum.
Markets now price a 67.5% chance of an October rate hike, up from 55.4% just one week ago. That repricing is the single biggest headwind for bullion right now.
This session is about preparation, not pursuit. Liquidity is thin, ATR is compressed at $16.70, and the real move likely waits for New York. Here is how to set up.
Gold Market Overview
Macro Context
The US Dollar is firmer across the board, and the long end of the Treasury curve is doing the heavy lifting. The 30-year yield touched 5.501% — a level not seen since June 2004 — while the 10-year climbed to 5.223%, the highest since June 2007.
Rising oil prices after stalled US-Iran talks have reinforced the inflation narrative. Higher crude feeds directly into headline CPI, which gives Fed hawks more cover to keep tightening.
New York Fed President John Williams and Cleveland Fed President Beth Hammack are both scheduled to speak later today. Their tone will matter more than any chart level in the next 24 hours.
Session Outlook
Asian liquidity is thin, and the ADX reading of 21.3 confirms a weak, ranging market. Expect the gold price to chop between $4,277 and $4,303 unless a headline breaks the range.
Do not chase. The Bollinger bands are compressed between $4,288.35 and $4,251.31, and a squeeze of this size usually resolves during the London or New York overlap.
Technical Analysis
Moving Average Structure
The gold price sits below the EMA200 at $4,327.49, which keeps the broader structure bearish. The EMA50 at $4,290.76 is acting as the immediate ceiling, while the EMA20 at $4,275.11 is providing a soft floor beneath current price.
That stack — price below EMA50 below EMA200 — is a classic bearish alignment. Bulls need a clean hourly close above $4,290.76 before the picture changes.
RSI and Momentum
RSI(14) is at 54.7, squarely in neutral territory. There is no overbought or oversold signal here, which means momentum traders have no edge yet.
The MACD reads -4.00 with a positive histogram of +3.59, suggesting the bearish momentum is fading even though the signal line remains negative. Stochastic at 69.7/63.9 is drifting toward overbought without confirming it.
Key Price Levels
Immediate resistance sits at R1 $4,288.56, then R2 $4,303.40 — which also marks the prior day high. Support is layered at S1 $4,282.63 and S2 $4,275.67.
With ATR at $16.70, the expected session range is roughly $4,271 to $4,305 if volatility stays normal. A break outside that band needs a catalyst.
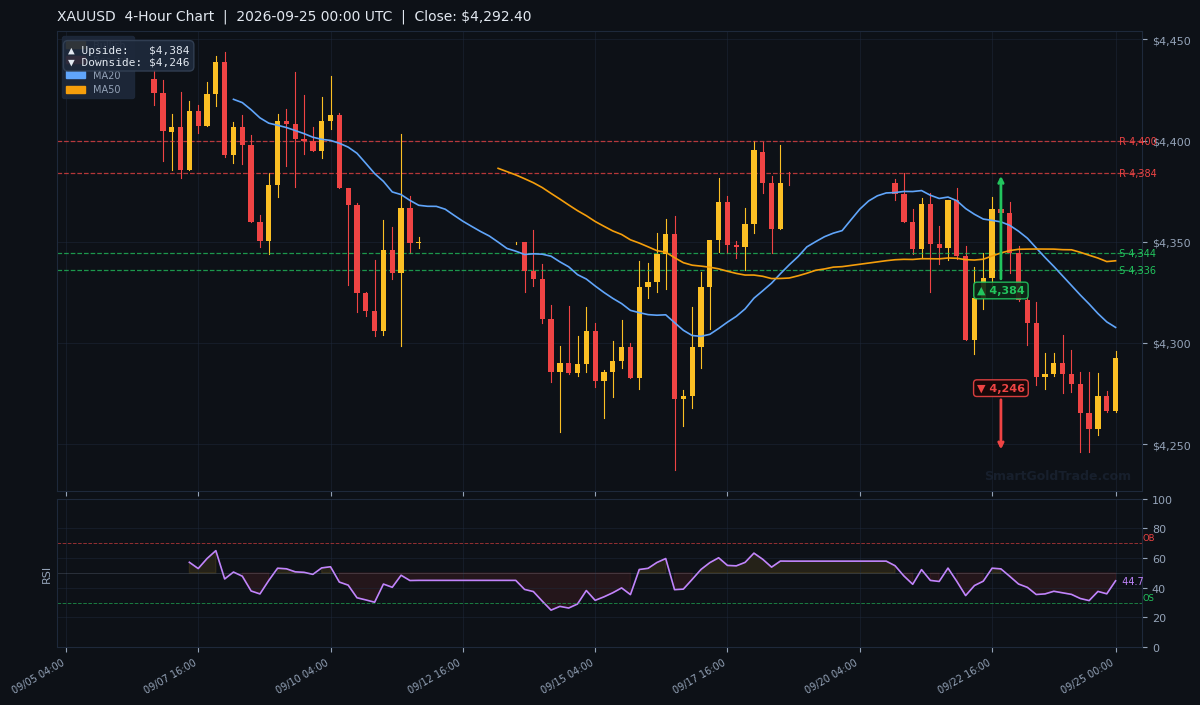
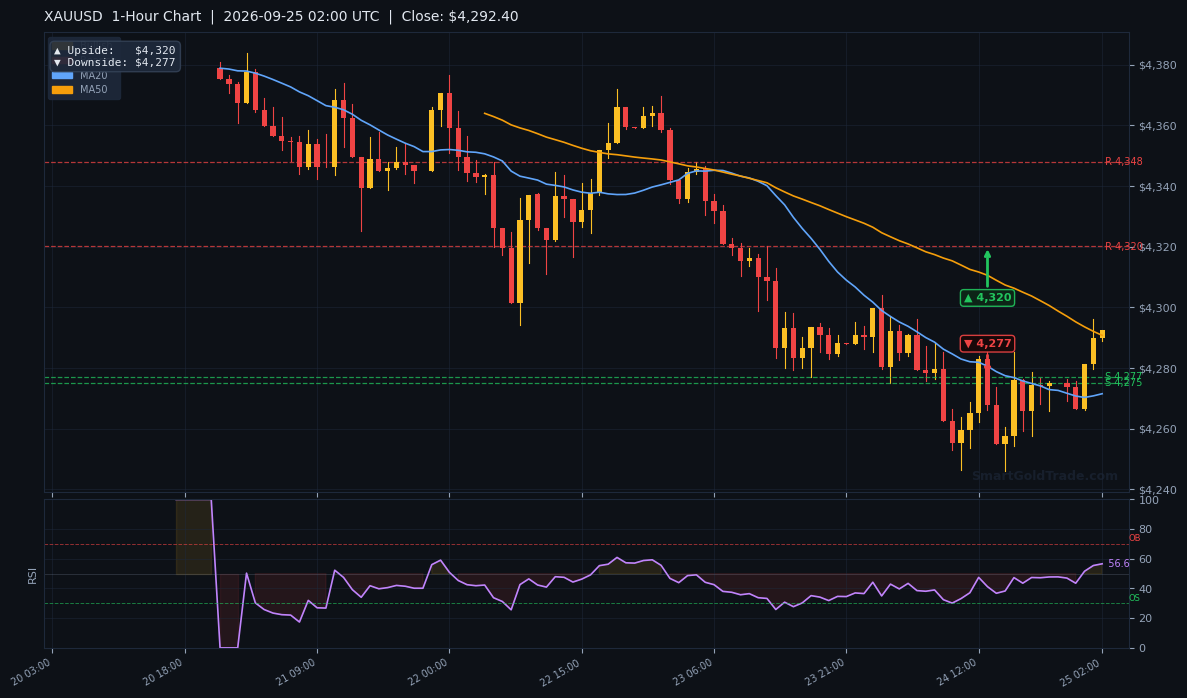
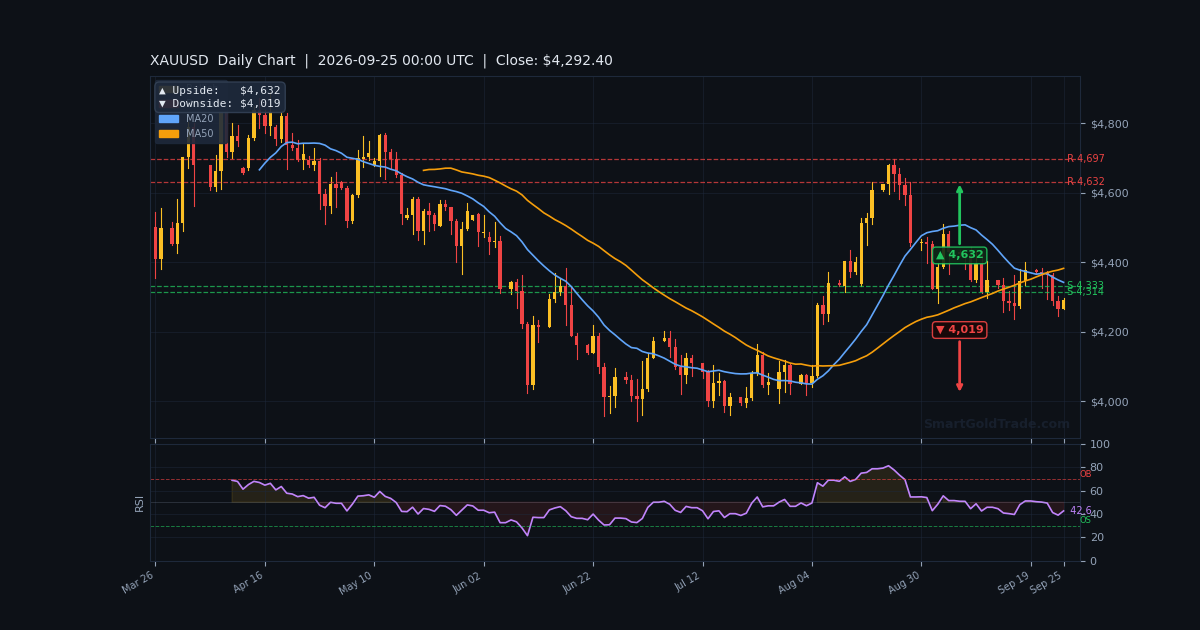
| Timeframe | Upside Target | Downside Target |
|---|---|---|
| Daily | $4,632 | $4,019 |
| 4-Hour | $4,384 | $4,246 |
| 1-Hour | $4,320 | $4,277 |
Fundamental Drivers
Two forces are pulling the gold price in opposite directions. On the bearish side, Fed officials have gone 'full hawkish' this week. Paulson's speech scored 8.1/10 on the FXS Speechtracker against a 7/10 baseline, and Williams called one more hike before year-end a 'reasonable expectation.'
On the bullish side, China's physical demand is quietly becoming a pillar. Customs data shows over 1,000 tons of gold imported in the first eight months of 2026 — already exceeding last year's total. The PBoC added roughly 80 tons between January and August, with August marking the strongest monthly buying in nearly three years.
That official-sector bid is a slow-burn floor under the market. It does not stop a hawkish Fed from pressuring spot, but it limits how deep any selloff runs.
Key Event to Watch
Today's Fed speakers — Williams and Hammack — are the immediate trigger. Both have already leaned hawkish this week, so the market is prepared. A softer tone would be the surprise that lifts the gold price back toward $4,303.40.
Beyond today, the October 28 FOMC meeting is the dominant event. Markets assign a 67.5% probability to a 25bp hike there. If that number climbs toward 80%, expect bullion to test the 4-hour downside target at $4,246.
Devil's Advocate
The bearish case rests entirely on the Fed following through. If October CPI surprises to the downside, or if oil retreats sharply on renewed Iran diplomacy, the hike odds could collapse back toward 40% within days.
That scenario would invalidate the bearish bias fast. The key reversal level is $4,290.76 — the EMA50. A sustained hourly close above it, followed by a push through R2 $4,303.40, flips the structure bullish and opens the 4-hour upside target at $4,384.
Watch the 30-year yield. If it slips back below 5.40%, gold rallies. If it holds above 5.50%, the pressure stays on.
Trading Strategy for Asian Session
The cleanest setup is a short from the R1 zone. Entry between $4,288.56 and $4,290.76, with a stop above the EMA50 and R2 confluence at $4,304 — roughly one ATR of risk.
First target is S1 at $4,282.63. Second target is S2 at $4,275.67. A third target at the 1-hour downside pivot of $4,277 aligns closely with S2, so scale out there.
For the long side, wait for a confirmed hourly close above $4,290.76. Entry on the retest, stop below $4,282, target R2 at $4,303.40 and then the 4-hour upside at $4,384.
Position sizing should be conservative. With ATR at only $16.70, false breaks are common in thin Asian volume. If you are not comfortable reading a ranging tape, the correct trade today is no trade. Traders who prefer hands-off execution can review copy trading options that mirror established gold desks rather than guessing at a compressed range.
Key Takeaways
- Gold price holds $4,287.82, trapped beneath R1 at $4,288.56.
- Bearish structure intact while price stays below EMA50 $4,290.76 and EMA200 $4,327.49.
- Fed hike odds at 67.5% for October — the dominant headwind.
- China imported over 1,000 tons in eight months, a structural floor.
- ATR of $16.70 implies a session range of roughly $4,271 to $4,305.
- Invalidation level: hourly close above $4,303.40.
Conclusion
The gold price is coiling in a tight range with a mild bearish tilt. Price below the EMA50 and EMA200 keeps sellers in control, and the hawkish Fed repricing gives them fundamental cover.
But this is not a market to chase. Thin Asian liquidity and a compressed ATR mean the real move waits for New York. The line in the sand is $4,290.76 — above it, bulls regain the initiative toward $4,303.40. Below it, sellers press toward $4,275.67 and then the 4-hour downside at $4,246.
Patient traders who wait for the retest will be rewarded. Those who jump at the first candle usually are not.
Frequently Asked Questions
- What is the gold price right now?
- The gold price is $4,287.82 on the H1 close at 02:00 UTC, up 0.30% on the day but still below the EMA200 at $4,327.49.
- Is gold bullish or bearish today?
- Mildly bearish. Price sits below both the EMA50 at $4,290.76 and EMA200 at $4,327.49, and RSI at 54.7 is neutral. A close above $4,303.40 would flip the bias.
- What are the key support levels for gold?
- Immediate support is S1 at $4,282.63, followed by S2 at $4,275.67. The 1-hour downside pivot sits at $4,277. A break below that opens $4,246.
- What is the gold price target for this week?
- The 4-hour chart targets $4,384 to the upside and $4,246 to the downside. The daily chart's wider range sits between $4,632 and $4,019.
- Will the Fed hike rates in October?
- Markets price a 67.5% probability of a 25bp hike at the October 28 meeting, up from 55.4% a week ago. That expectation is the main weight on the gold price.
Trading Gold (XAU/USD) carries significant risk of loss and is not suitable for all investors. This content is for informational purposes only and does not constitute financial advice. Always conduct your own research and trade responsibly.