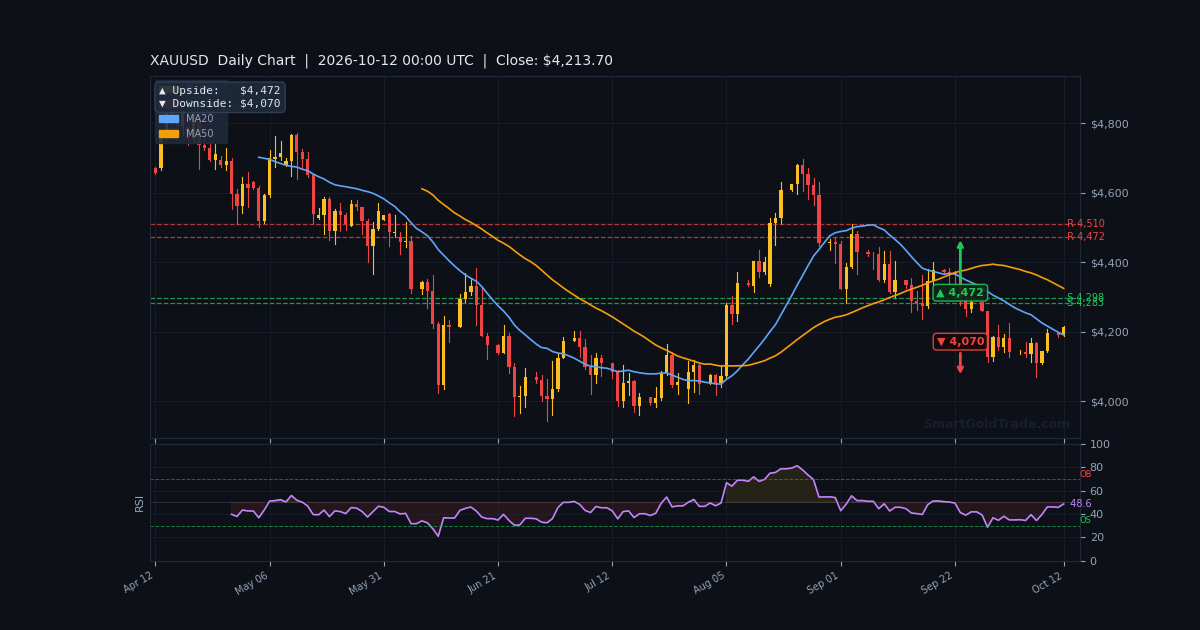
The gold price is holding $4,211.97 in the Asian session, trading just above the prior day high of $4,207.49 and pressing against the first layer of resistance at $4,219.42. This quiet, low-liquidity window follows last week's softer US bond yields, which kept the dollar on the back foot and allowed bullion to reclaim ground above its key moving averages. Momentum is constructive, but the market is not yet in a hurry.
With the daily open at $4,189.59 and price up 0.53% on the day, buyers have clearly taken the early initiative. The question now is whether they can convert this drift into an actual breakout before London arrives. Thin books mean false moves are common, so patience matters more than aggression right now.
This session is about preparation, not chasing. The levels are clear, and the plan should be written before the volume returns.
Gold Market Overview
Macro Context
The macro backdrop remains mildly supportive for the gold price. The US Dollar Index has softened as Treasury yields pulled back from multi-year highs, and that combination typically gives bullion room to breathe. Fed Chair Kevin Warsh is scheduled to speak on Friday, and traders will parse every word for clues on the next policy step.
Geopolitical risk is still simmering in the background. The ongoing US-Iran standoff continues to feed a slow, steady bid for safe-haven assets, though it has not yet produced a headline-driven spike. That kind of risk tends to support gold on dips rather than launch it vertically.
Session Outlook
The Asian session is thin, and that changes the character of the tape. Ranges tend to compress, stop runs are sharper, and breakouts are less reliable than they look. Expect the gold price to spend most of this window between $4,203 and $4,219 unless a fresh headline lands.
The key trigger to watch is whether price can hold above VWAP at $4,203.68. As long as it does, the intraday bias stays tilted to the upside. A clean loss of that level would shift focus back toward the EMA20 at $4,187.89.
Technical Analysis
The technical picture on the H1 chart is bullish but stretched. Price is trading above all three key moving averages, ADX is printing 39.0, and the trend structure remains intact. The caveat is that momentum oscillators are already leaning into overbought territory, which argues for consolidation rather than an immediate vertical push.
Moving Average Structure
The EMA20 sits at $4,187.89, the EMA50 at $4,167.69, and the EMA200 at $4,170.60. Price at $4,211.97 is above all three, and critically, it is above the EMA200 — a classic bull structure. The EMA20 is the first dynamic support to watch on any pullback.
RSI and Momentum
The RSI(14) is at 68.7, which sits in the neutral range but is closing in on overbought. The Stochastic reads 83.6/73.6, confirming strong short-term momentum, while MACD at 12.49 with a histogram of -0.08 hints that momentum is flattening. Translation: the trend is up, but the easy part of the move may already be priced in.
Key Price Levels
Resistance is stacked at $4,219.42 (R1) and $4,227.53 (R2). Support is layered at $4,168.57 (S1) and $4,165.69 (S2). The ATR(14) of $13.08 suggests an expected hourly range of roughly 0.31% of price — modest, consistent with a quiet Asian session.
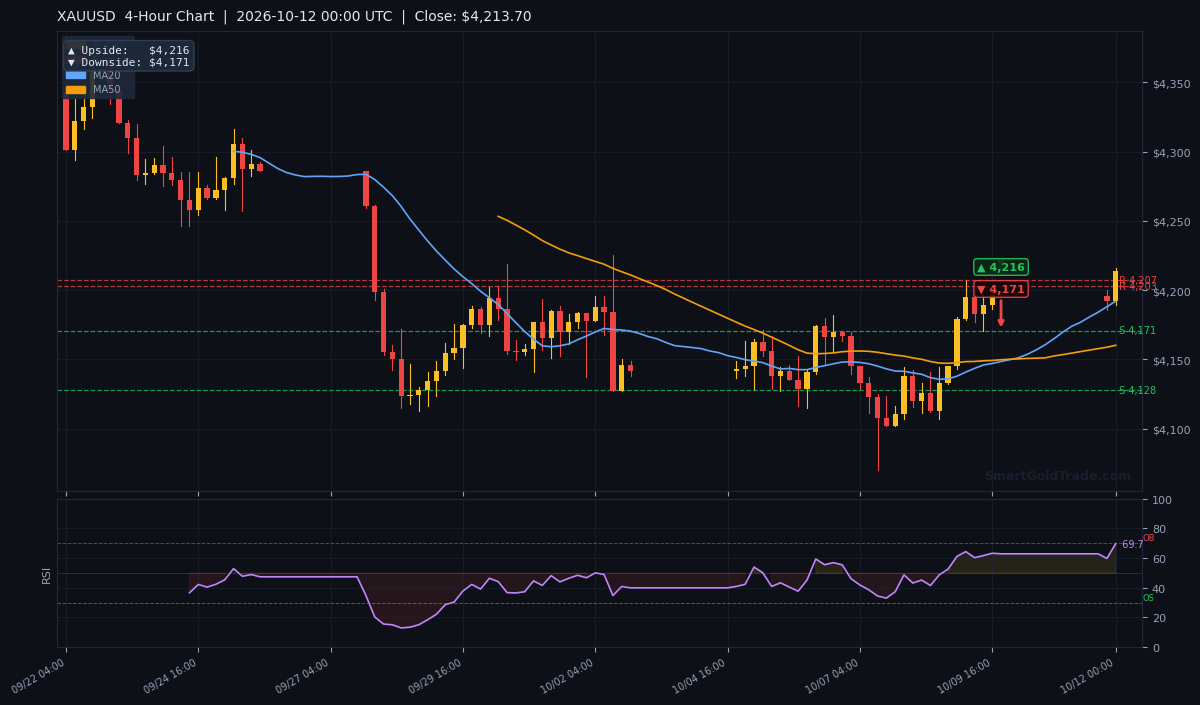
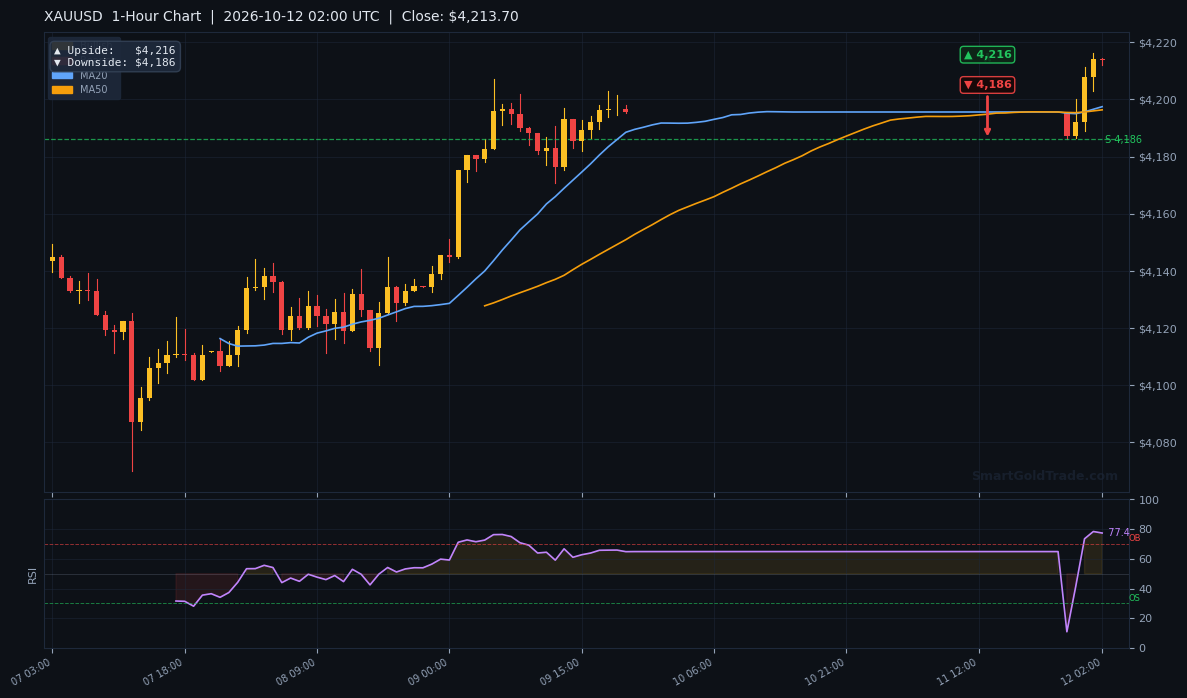
| Timeframe | Upside Target | Downside Target |
|---|---|---|
| Daily | $4,472 | $4,070 |
| 4-Hour | $4,216 | $4,171 |
| 1-Hour | $4,216 | $4,186 |
Fundamental Drivers
Two threads matter most this week. First, last week's softer US bond yields continued to weigh on the dollar, and that has been the single biggest tailwind for the gold price. Second, the US-Iran standoff remains unresolved, keeping a steady safe-haven bid underneath the market.
Analysts are split on the near-term path. Some see a counter-trend rally extending toward the mid-$4,400s, while others warn that bears are gaining traction and could drag price back toward $4,300. That divergence is exactly why level-based trading beats prediction right now.
Key Event to Watch
The single most important event this week is Fed Chair Kevin Warsh's speech on Friday. Any hawkish tilt would lift the dollar and pressure gold; a dovish or data-dependent tone would likely give bulls the fuel to test $4,227.53 and beyond.
Devil's Advocate
The bull case looks clean, but it is not invincible. The RSI at 68.7 and Stochastic above 83 warn that the gold price is running hot in the short term. If buyers fail to clear $4,219.42 on the first attempt, a fade back toward VWAP at $4,203.68 becomes the path of least resistance.
The real invalidation level is the EMA20 at $4,187.89. A decisive hourly close below it would flip the intraday bias to neutral and open the door to $4,168.57. Any break under S1 would signal that the counter-trend rally has stalled.
Trading Strategy for Asian Session
Given thin liquidity, the disciplined play is to buy pullbacks rather than breakouts. The primary entry zone sits between $4,203.68 (VWAP) and $4,207.49 (prior day high), where the trend and value align.
Place the stop loss one ATR below entry, roughly $13 wide, which puts a logical stop near $4,194. That keeps risk defined while respecting the expected hourly range. For traders who prefer tighter risk, the EMA20 at $4,187.89 is the hard line in the sand.
Take profit targets are layered. The first target is $4,219.42 (R1), the second is $4,227.53 (R2), and an extended run could reach the 4-hour upside pivot at $4,216 before the session closes. If price instead breaks below $4,187.89, stand aside and wait for the London open.
For traders who want a rules-based approach without staring at the screen, professional gold trading signals can help align entries with institutional flow. Those preferring to hold physical metal for the long term may find value in SmartGoldTrade's physical gold products.
Key Takeaways
- The gold price is holding $4,211.97, above all key EMAs, confirming a bull structure.
- RSI at 68.7 and Stochastic at 83.6 warn of short-term overextension — expect consolidation.
- Immediate resistance sits at $4,219.42, with the next hurdle at $4,227.53.
- Support is layered at $4,168.57 (S1) and $4,165.69 (S2).
- ATR of $13.08 implies a modest hourly range of roughly 0.31% — do not chase.
- Fed Chair Warsh's Friday speech is the week's biggest catalyst for gold.
Conclusion
The gold price enters the Asian session with a mildly bullish bias, supported by a soft dollar, steady safe-haven demand, and a clean moving-average structure. The immediate task for bulls is to defend $4,203.68 and push through $4,219.42.
If that resistance gives way, the door opens to $4,227.53 and potentially the 4-hour pivot at $4,216. If it holds, expect a quiet drift back toward the EMA20 at $4,187.89, where buyers will get a second chance. Either way, this is a session for patience and pre-planned levels, not impulsive entries.
Frequently Asked Questions
- What is the gold price right now?
- The gold price is $4,211.97 as of the H1 bar close at 02:00 UTC on October 12, 2026, up 0.53% on the day.
- What are the key resistance levels for gold today?
- The first resistance is $4,219.42 (R1), followed by $4,227.53 (R2). A break above R2 would open the path toward the daily upside pivot at $4,472.
- What support levels should I watch if gold falls?
- Immediate support sits at $4,168.57 (S1) and $4,165.69 (S2). The EMA20 at $4,187.89 is the first dynamic level to watch on any pullback.
- Is now a good time to buy gold?
- With RSI at 68.7, the gold price is stretched in the short term. A pullback toward VWAP at $4,203.68 offers a better risk-reward entry than chasing at current levels.
- What event could move gold the most this week?
- Fed Chair Kevin Warsh's speech on Friday is the key catalyst. A hawkish tone could push gold toward $4,168.57, while a dovish tone could send it past $4,227.53.
Trading Gold (XAU/USD) carries significant risk of loss and is not suitable for all investors. This content is for informational purposes only and does not constitute financial advice. Always conduct your own research and trade responsibly.