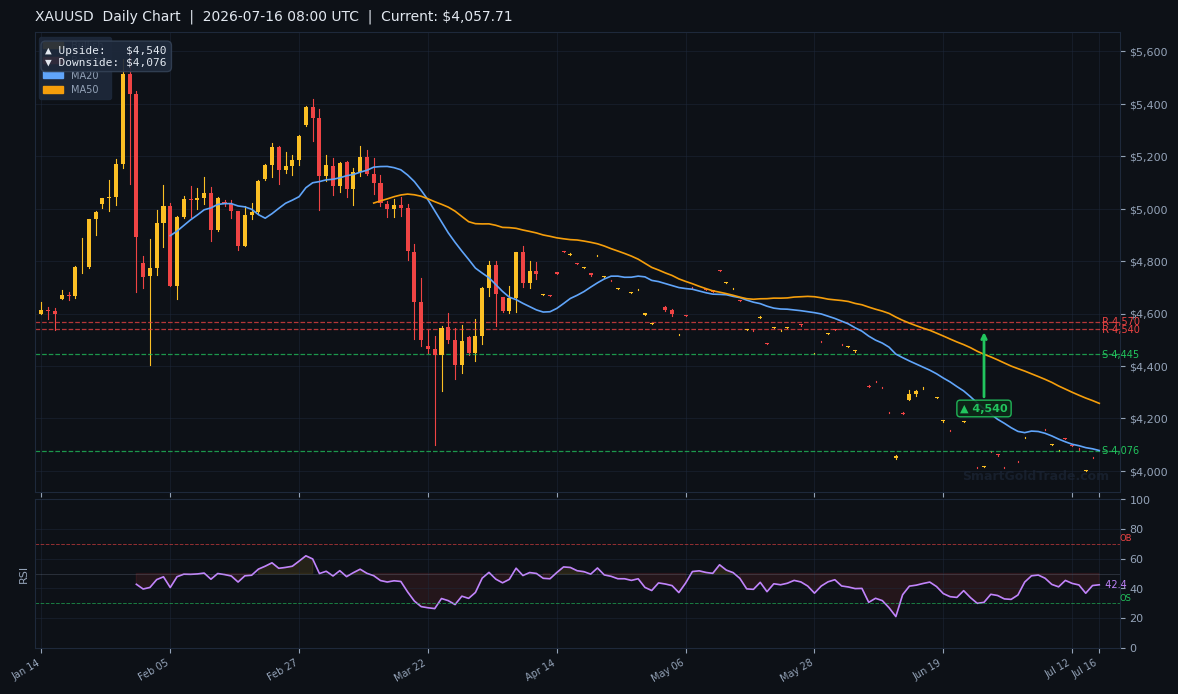
Gold price opens the European session at $4,035.66, sliding below every significant moving average and reigniting fears of a deeper correction. London desks are now active, and the immediate downside target — $4,124, the 4-hour pivot low from the Price Action data — is already under threat.
Overnight, China’s M2 money supply for June came in at 8%, missing the 8.5% consensus, a figure that drained risk appetite across Asian commodity markets and left gold without a meaningful bounce. The US dollar index holds firm near 104.2, and 10-year Treasury yields remain elevated at 4.25%, a combination that usually spells trouble for non-yielding assets. With no top-tier US data release today, the intraday direction will be decided by technical flows and the ability of sellers to force a test of $4,027 — the 1-hour pivot downside target. What happens in the next two hours could set the tone for the rest of the week.
Every European morning brings a fresh wave of liquidity, and today that liquidity is overwhelmingly bearish. The gold price has already sliced through its 20-period moving average, and the failure to reclaim even the $4,040 mark early in the session underscores the urgency for swing traders to reassess their long positions. The question now is not whether gold can rally, but how low the sell-off can go before bargain hunters step in.
Gold Market Overview
Macro Context
The macro backdrop continues to favour the US dollar, which acts as an anchor on gold price. The Dollar Index (DXY) is consolidating around 104.2, up 0.3% from Monday’s close, reflecting a market still pricing in a “higher-for-longer” Federal Reserve. The CME FedWatch Tool shows a negligible probability of a rate cut before September, and even that is contingent on a string of soft inflation prints. Until traders see concrete evidence of a dovish pivot, the opportunity cost of holding gold remains high — especially with the 10-year Treasury yield hovering at 4.25%, near multi-month highs.
Geopolitical risk, often a wildcard for bullion, is simmering but not boiling over. Tensions in the South China Sea and renewed trade rhetoric from Washington are keeping a floor under safe-haven demand, but they are not enough to offset the weight of a stronger greenback and rising real yields. The net result is a gold price that is vulnerable to sharp, momentum-driven drops whenever a headline disappoints — exactly the scenario set up by this morning’s Chinese M2 miss.
Session Outlook
European hours tend to amplify trends that begin in Asia, and today is no exception. With London trading desks back from their morning meetings, the selling pressure that pushed gold price below $4,040 is likely to accelerate. The typical European session range, guided by the ATR of $12.75, points to a daily band of approximately $25.50, which translates into a likely floor near $4,010 if sentiment remains uniformly negative. However, the more probable target for profit-taking sits at the 1-hour pivot low of $4,027, with a secondary objective at $4,124 — the 4-hour downside marker that aligns with today’s most critical support.
Traders should watch for two potential triggers: first, any ECB commentary that weakens the euro and indirectly boosts the dollar; second, US equity futures, which can shift risk appetite in a matter of seconds. Without a macro catalyst, the session will be driven by option expiries and stop-loss clusters below $4,030. A clean break of that level could open the door to a cascade of automated selling.
Technical Analysis
Moving Average Structure
The moving average layout for the H4 chart is unequivocally bearish. The gold price at $4,035.66 sits beneath the 20-period simple moving average at $4,040.81, which had previously provided mild dynamic support but now acts as a ceiling. More significantly, the 50-period MA at $4,086.69 and the 200-period MA at $4,183.80 loom far above, reinforcing the message that this is not a dip to be bought, but a trend to be respected. The EMA structure confirms the weakness: with the MA20 crossing decisively below the MA50, short-term bearish pressure is intensifying.
When price is below all three of these widely followed averages, institutional models often flip to “sell only” mode. This structural alignment explains why every minor rally attempt during the Asian session was met with aggressive offers near $4,038.
RSI and Momentum
The 14-period Relative Strength Index reads 43.9, placing it squarely in the neutral-to-bearish zone. It is not yet oversold — a reading below 30 would be required for that label — which means there is still room for the gold price to fall before a meaningful mean-reversion trade emerges. A sub-50 RSI on the H4 timeframe often signals that momentum is aligned with the prevailing downtrend, and that bounces are likely to be sold rather than chased.
This RSI level also provides a practical threshold for trading: a move above 50 would be an early warning that bearish momentum is stalling. Until then, chart-based strategies should favour short entries on pullbacks toward the MA20.
Key Price Levels
Despite the break lower, some historical reference points remain relevant. Support S1 at $4,164.51 and S2 at $4,147.61 have now been violated, and any recovery attempt will likely face stiff resistance at those former floors. On the upside, Resistance R1 at $4,184.32 and R2 at $4,181.55 are far enough away that a bullish reversal is not a near-term scenario. Instead, the primary levels to monitor today are the pivot-derived targets: the 4-hour downside at $4,124 and the 1-hour downside at $4,027. The AT reading of $12.75 suggests that a single intraday swing could easily cover the distance between these two markers.
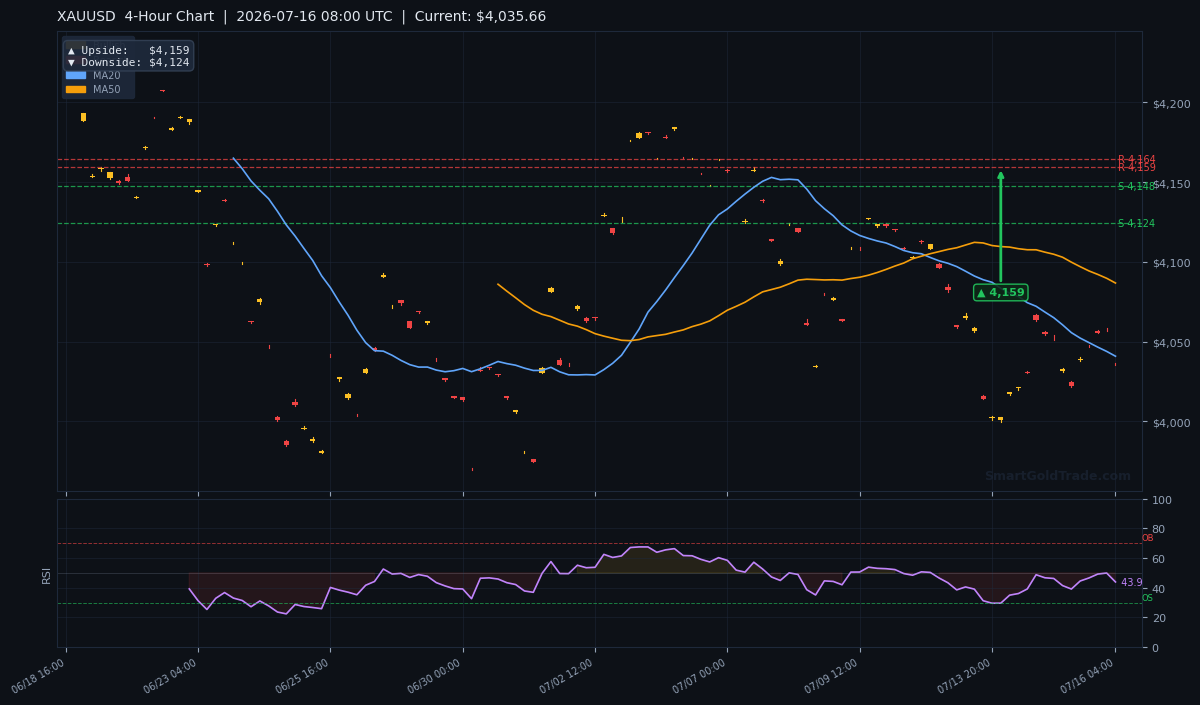
The 4-hour chart paints a vivid picture of a market that has lost all upward traction. Three consecutive bearish candles have pushed price below the consolidation zone that held for the past week, and the 50-MA cross under the 200-MA — known as a death cross on this timeframe — is only days away from confirming. For swing traders, this is a stark reminder that counter-trend entries carry outsized risk.
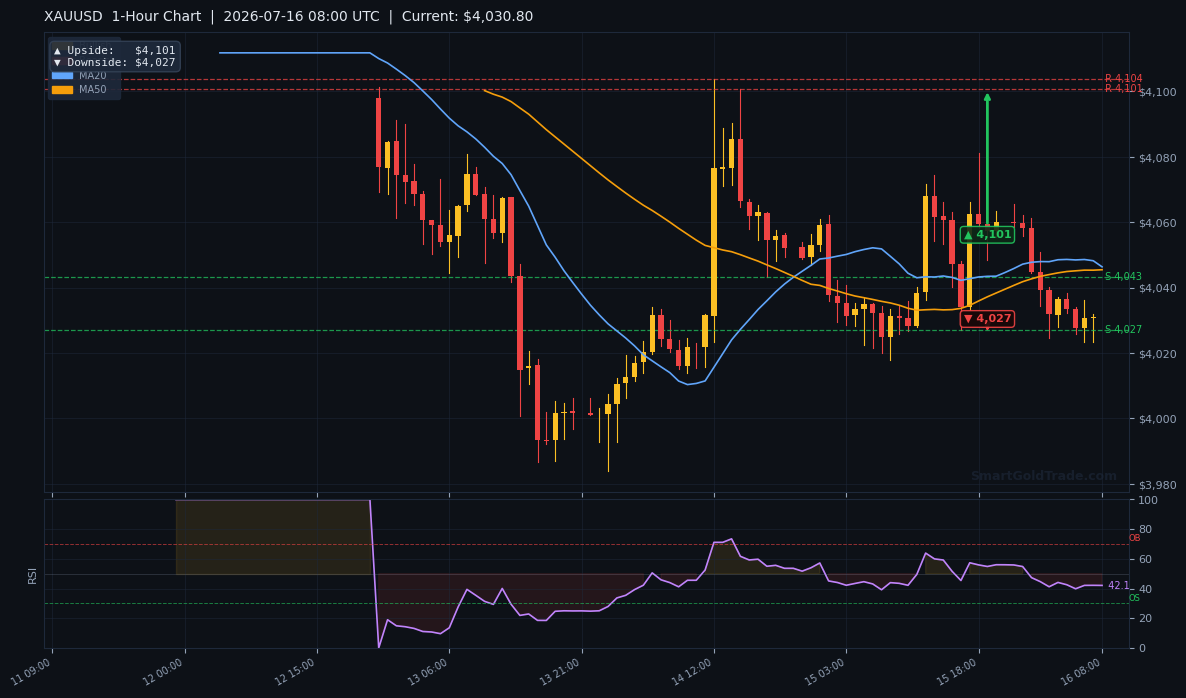
Zooming into the 1-hour chart reveals a short-term descending channel that began forming after the London fix. The gold price is now testing the lower boundary of that channel near $4,032, and a failure to hold here would align with the $4,027 target drawn from the pivot arrows. Volume indicators also show rising selling pressure, suggesting that the move is not yet exhausted.
| Timeframe | Upside Target | Downside Target |
|---|---|---|
| Daily | $4,540 | $4,076 |
| 4-Hour | $4,159 | $4,124 |
| 1-Hour | $4,101 | $4,027 |
Fundamental Drivers
The overnight release of China’s M2 money supply data for June — 8% year-on-year versus the 8.5% estimate — is the proximate cause of this morning’s weakness in gold price. Chinese investors are a major source of marginal demand for physical bullion, and tighter-than-expected liquidity conditions often translate into reduced buying from the world’s second-largest gold consumer. The data landed during the Asian session, and the immediate market reaction was a $12 sell-off in spot gold, pushing it from $4,047 to $4,035 in less than 90 minutes.
Beyond the Chinese data point, the underlying driver remains Federal Reserve policy. Minutes from the June FOMC meeting, released last week, reiterated that officials are not yet confident inflation is on a sustained path to 2%. With Fed Chair Jerome Powell scheduled to speak at the Economic Club of Washington later this week, the market is on edge for any hawkish nuance that could further lift the dollar. The inverse correlation between DXY and gold has strengthened to -0.83 over the past 20 sessions, making every pip of dollar strength a direct headwind for gold price.
Key Event to Watch
The single most important event for the remainder of the week is Thursday’s US retail sales report for June. Consensus expects a 0.3% month-on-month increase in the headline figure. A reading above 0.5% would reinforce the “no landing” narrative for the US economy, sending yields and the dollar higher — a scenario that would almost certainly push gold price toward the $4,027 downside target, if not deeper. Conversely, a negative print could offer a temporary reprieve, but with the technicals so heavily aligned against bulls, any bounce is likely to be capped near the MA20 at $4,040.81.
Devil’s Advocate
The bearish thesis collapses if the gold price manages to recover above the $4,040 mark and, more importantly, hold a sustained move above the MA50 at $4,086.69. Such a reversal would require a sudden dovish shift from a Fed speaker or an unexpected geopolitical event that triggers a flight to safety. Another scenario that would force a rethink is a sharp drop in DXY below 103.5, a level that has acted as a floor since mid-July. However, with the 14-period RSI still miles from oversold territory and short-term momentum firmly negative, the probability of a V-shaped recovery remains low. The most realistic invalidation point for swing shorts sits at $4,164.51 — the former support S1, now a formidable resistance. Until price closes above that level on the daily chart, the path of least resistance points lower.
Trading Strategy for European Session
Given the overwhelming bearish structure, the preferred approach for the European session is to sell rallies into intraday resistance. The entry zone sits between $4,037 and $4,042, which aligns with the MA20 and the top of the descending 1-hour channel. A stop loss placed at $4,055 — roughly one and a half times the ATR above the MA20 — provides enough room to avoid being shaken out by noise while still protecting capital. The initial profit target is $4,027, the 1-hour pivot low, with a secondary target at $4,124 for anyone willing to hold through potential afternoon volatility.
Risk-averse traders can scale out 50% of the position at the first target and move the stop to breakeven. For those using a no-leverage platform, halal gold trading provides a way to short physical without incurring swap fees or margin calls — a critical advantage when volatility spikes and overnight risks mount. If managing entries and exits manually feels overwhelming, consider copy trading to automatically follow expert gold traders without the need for constant chart analysis. Regardless of the execution method, this is not an environment to chase momentum lower; wait for the retracement, confirm the rejection, and then enter with a disciplined stop.
Key Takeaways
- Gold price at $4,035.66 has broken below the MA20, confirming a bearish shift.
- With RSI at 43.9, downside momentum has room to run before any mean-reversion bounce.
- Primary targets are $4,027 (1-hour) and $4,124 (4-hour); sellers remain in control.
- Thursday’s US retail sales release is the next major catalyst — a strong print could accelerate the sell-off.
FAQ
What is the gold price today?
The live gold price (XAU/USD) is $4,024.75 per troy ounce as of July 16, 2026, 12:30 UTC.
Why is the gold price falling this morning?
A combination of a resilient US dollar, elevated Treasury yields, and disappointing Chinese M2 data are weighing on gold, reinforced by a bearish technical structure that has triggered stop-loss selling below key moving averages.
Can I trade gold in a Shariah-compliant way?
Yes — SmartGoldTrade offers halal, interest-free spot gold trading with physical ownership and no leverage, making it fully Shariah-compliant and free from riba.