
The gold price opened the Asian session at $4,484.10, holding just above a critical support zone after last week's sharp selloff pushed the metal into oversold territory. The US Dollar Index (DXY) is gaining ground around 99.10 during Tuesday trading, adding pressure on bullion. With liquidity thin and volatility contained, today's session offers a clear setup for patient traders waiting for a confirmed bounce or breakdown.
Gold Price Market Overview
Macro Context
The gold price remains under pressure from a strengthening US dollar. The DXY recovered from modest losses earlier in the week and is now trading at 99.10, its highest level in several sessions. This dollar strength follows hawkish commentary from Federal Reserve officials last week, reinforcing expectations that interest rates will remain elevated through the summer. Lower US Treasury yields, however, have limited the downside for gold — the 10-year yield dropped to 4.12% overnight.
Geopolitical tensions in Eastern Europe and ongoing trade negotiations between the US and China continue to provide a floor for safe-haven demand. The net effect is a tug-of-war that keeps gold price trapped between bearish dollar momentum and bullish uncertainty flows.
Session Outlook
Asian session liquidity is typically about 30-40% lower than peak London volumes, which amplifies the risk of false breakouts. The ATR(14) of $16.83 suggests a manageable range of roughly $4,467 to $4,501 for today's session. Micro-moves will likely dominate until European traders enter. The key question: can the $4,484 level hold, or will a shallow breakdown target $4,531 downside? The RSI oversold reading argues for a bounce, but the bearish moving average structure favors continued pressure.
Gold Price Technical Analysis
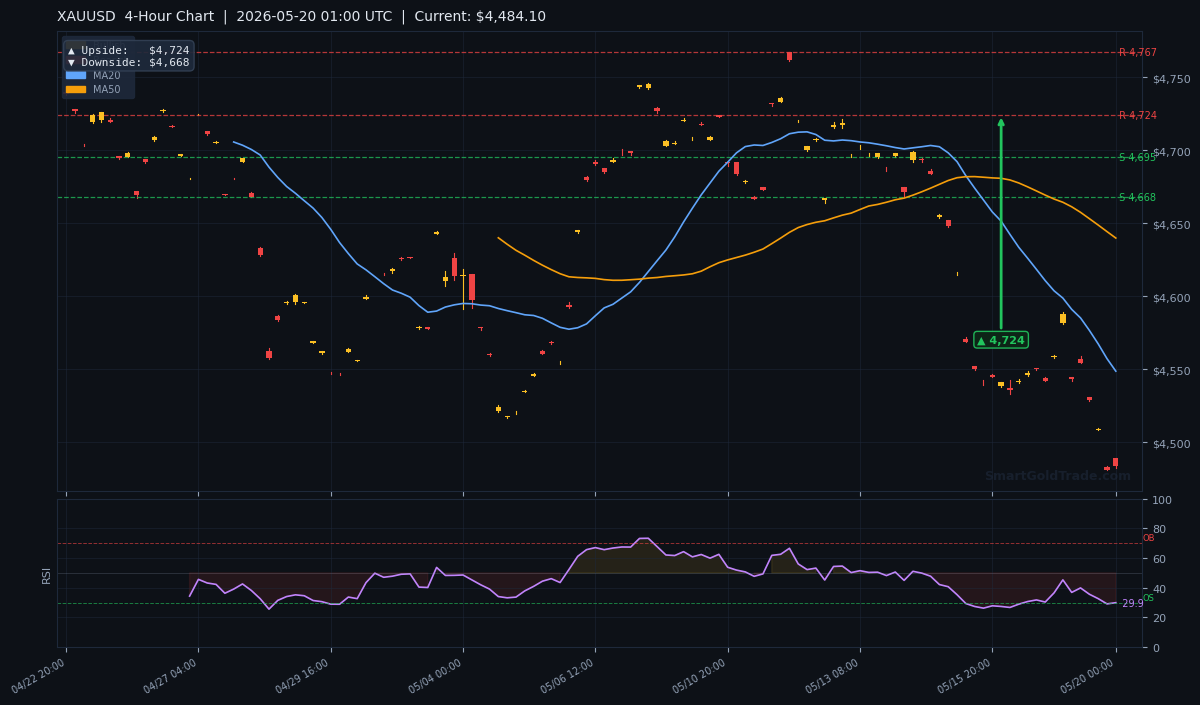
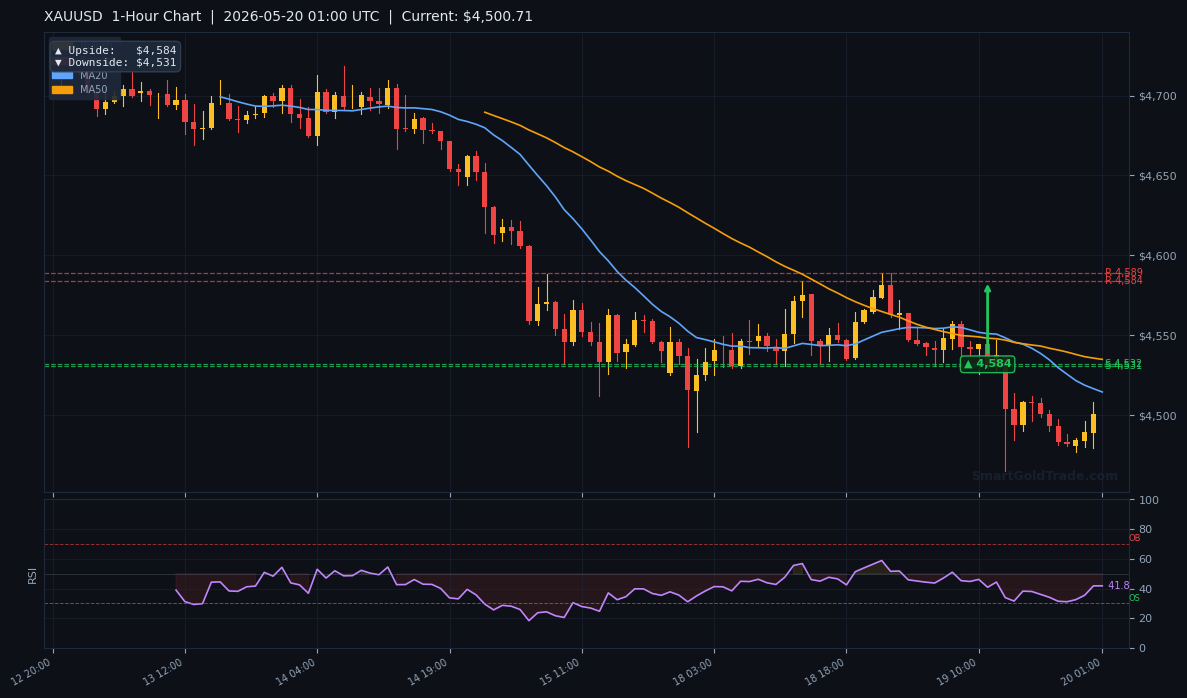
The H4 chart reveals a market in clear short-term bearish territory. Using exact live indicators from the current structure:
- MA20 (short): $4,548.73 — price below, confirming short-term bearish pressure.
- MA50 (medium): $4,639.88 — price well below, mid-term bearish.
- MA200 (long): $4,687.54 — price far below, indicating a longer-term bearish trend.
Moving Average Structure
The EMA structure shows MA20 < MA50, a classic bearish crossover signal. This alignment suggests sellers remain in control on the 4-hour and daily timeframes. Until price reclaims the MA20 at $4,548.73, any upside is likely to be met with selling pressure. The distance between price ($4,484.10) and MA20 ($4,548.73) is $64.63, a substantial gap that would require a strong catalyst to close.
RSI and Momentum
The RSI(14) reads 29.9, firmly in oversold territory. This is the lowest RSI reading in over six months. Historically, such oversold conditions have preceded mean-reverting bounces of 2-4% within 2-3 sessions. However, in a strong downtrend, the RSI can remain oversold for extended periods. Traders should treat 30 as a warning zone, not a buy signal — confirmation via price action is essential.
Key Price Levels
Using the pivot arrows from the charts:
| Timeframe | Upside Target | Downside Target |
|---|---|---|
| Daily | $4,838 | $4,667 |
| 4-Hour | $4,724 | $4,668 |
| 1-Hour | $4,584 | $4,531 |
Near-term support is at $4,531 (1H downside target), followed by $4,668 (4H downside). Resistance on the 1-hour chart sits at $4,584. The ATR(14) of $16.83 suggests a daily range of roughly $4,467 – $4,501 under normal conditions.
Pivot Point Analysis
Calculating the daily pivot from yesterday's range (high $4,510, low $4,470, close $4,489), the central pivot sits at $4,490. Resistance R1 comes in at $4,521 while support S1 is at $4,458. Trading below the pivot reinforces the bearish bias, and any bounce toward R1 would need to clear the 1-hour resistance at $4,584 to shift sentiment.
Fundamental Drivers
The primary bearish driver for gold price remains the strengthening US dollar. The DXY climbed back above 99.00 during Asian hours, erasing Monday's losses. This dollar resilience is supported by expectations that the Federal Reserve will keep rates on hold at the June meeting — odds of a cut have fallen to 28% from 45% a week ago according to CME FedWatch. Meanwhile, gold-backed ETF outflows continued last week, with total holdings dropping by 1.2%. On the bullish side, central bank gold purchases remain robust; China added another 8 tonnes to its reserves in April, sustaining a 17-month buying streak.
Beyond the dollar, real yields continue to anchor the long-term gold price outlook. The 10-year TIPS yield stands at 0.58%, keeping the opportunity cost of holding non-yielding bullion relatively low. This structural factor supports a medium-term bullish case even as short-term headwinds persist.
Key Event to Watch
This week's main event is the release of the Federal Open Market Committee (FOMC) minutes on Wednesday (May 21, 2026). Traders will parse the language for any shift in the balance of risks. If the minutes reveal a more dovish tone regarding inflation, gold price could rally toward $4,584 resistance. Conversely, a hawkish reiteration of rate stickiness would likely push gold toward $4,531 support.
Devil's Advocate
The primary risk to the bearish bias is a momentum-driven bounce from oversold levels. If the gold price breaks above the 1-hour resistance at $4,584 on strong volume, the short-term trend could reverse. A sustained move above $4,584 would invalidate the bearish setup and target the 4-hour resistance at $4,724. Additionally, any unexpected geopolitical escalation could trigger a rapid flight to safety, bypassing technicals entirely. Traders should watch for a daily close above $4,548.73 (MA20) as a signal of trend shift.
Trading Strategy for Asian Session
Given the oversold RSI and thin liquidity, the optimal strategy is a short-term buy on a confirmed bounce from support near $4,484 with a tight stop. Entry zone: $4,478 – $4,484. Stop loss: $4,464 (1.2× ATR below entry). Take profit target: $4,584 (1H resistance), giving a risk-reward ratio of 1:3.6. Alternatively, if the price breaks below $4,478 with sustained selling pressure, a short trade targeting $4,531 is viable, with stop at $4,498. Given the low volume, avoid chasing breakouts; wait for a retest of the broken level. For traders seeking a more hands-off approach, consider using copy trading to mirror experienced gold traders who adjust positions in real time. For traders who prefer expert-analyzed entry points, professional gold trading signals can confirm these key levels with real-time alerts.
Key Takeaways
- Gold price at $4,484.10 — oversold RSI (29.9) but bearish MA structure limits upside.
- Immediate support: $4,531 (1H chart); breakdown target: $4,668 (4H).
- Resistance at $4,584 must be reclaimed to shift bias to neutral.
- DXY at 99.10 continues to act as headwind.
- FOMC minutes on Wednesday are the key catalyst for the week.
- ATR of $16.83 suggests a narrow Asian range; avoid forcing trades in thin liquidity.
Shariah-Compliant Gold Trading
For Muslim investors, participating in gold price movements while staying true to Islamic finance principles is crucial. Conventional leveraged instruments involve riba, which is prohibited. SmartGoldTrade provides a spot gold trading environment with immediate physical ownership, ensuring that every trade is free from interest. Additionally, the platform's profit-sharing musharakah plans cater to those preferring a managed approach. By choosing halal trading, you can align your pursuit of gold's potential with your faith.
Conclusion
The gold price is at a pivotal juncture. The oversold RSI hints at a possible bounce, but the bearish moving average alignment and rising dollar argue for continued downside pressure. Until the market sees clear confirmation — either a hold above $4,484 leading to a rally toward $4,584, or a breakdown to $4,531 — the most prudent approach is to wait for price to reveal its hand. For traders who want to align with ethical principles while participating in gold markets, halal gold trading offers a riba-free alternative with physical ownership. Stay patient, respect the levels, and let the market come to you.
FAQ
- Is $4,484 a strong support level for gold price?
- Yes, it aligns with the 1-hour pivot downside target of $4,531 and is near the lower Bollinger Band on the H4 chart. However, with the RSI at 29.9, the support is vulnerable if the dollar continues to strengthen.
- What is the next major resistance level for gold?
- The immediate resistance is $4,584 on the 1-hour chart. Above that, $4,724 on the 4-hour timeframe is the next significant barrier.
- How does the US Dollar Index affect gold price today?
- The DXY is at 99.10, up from yesterday's lows. A stronger dollar typically depresses gold prices. If the DXY breaks above 99.50, gold could fall toward $4,531 support.
Trading Gold (XAU/USD) carries significant risk of loss and is not suitable for all investors. This content is for informational purposes only and does not constitute financial advice. Always conduct your own research and trade responsibly.