Gold opens the week at $4,174.54 per troy ounce, extending gains after last Friday’s dismal US employment report slashed rate‑hike expectations. The XAU/USD pair rebounded sharply from the $3,980 region, closing above the short‑term moving averages and leaving bears on the defensive.
This gold price forecast next week covers the pivotal week of July 5–11, 2026. We examine last week’s price action, map key economic releases, break down technical levels, and lay out actionable trading scenarios for the days ahead.
Last Week in Review
Price Action Recap
Monday opened under heavy downside pressure, with gold testing the year‑to‑date low near $3,980 as hawkish Fed rhetoric and geopolitical anxiety boosted the US dollar. The sell‑off stalled midweek, and buyers stepped in aggressively after a much weaker‑than‑expected Non‑Farm Payrolls print on Friday.
By Friday’s close, gold had snapped a three‑session losing streak, rallying past $4,150 and settling at $4,174.54. The weekly candle formed a long lower wick, a classic bullish reversal signal that often precedes further upside.
Key Events That Moved Gold
Last week’s dominant driver was the US June NFP report released on July 03. The economy added just 75,000 jobs against a consensus forecast of 185,000, while average hourly earnings cooled to 0.1% month‑on‑month.
This data instantly repriced the Federal Reserve’s tightening path, sending the US Dollar Index lower and propelling gold nearly $200 off its lows. Earlier in the week, safe‑haven flows into the dollar on renewed Iran tensions had weighed on bullion, but the NFP miss flipped the sentiment dramatically.
Weekly Close Analysis
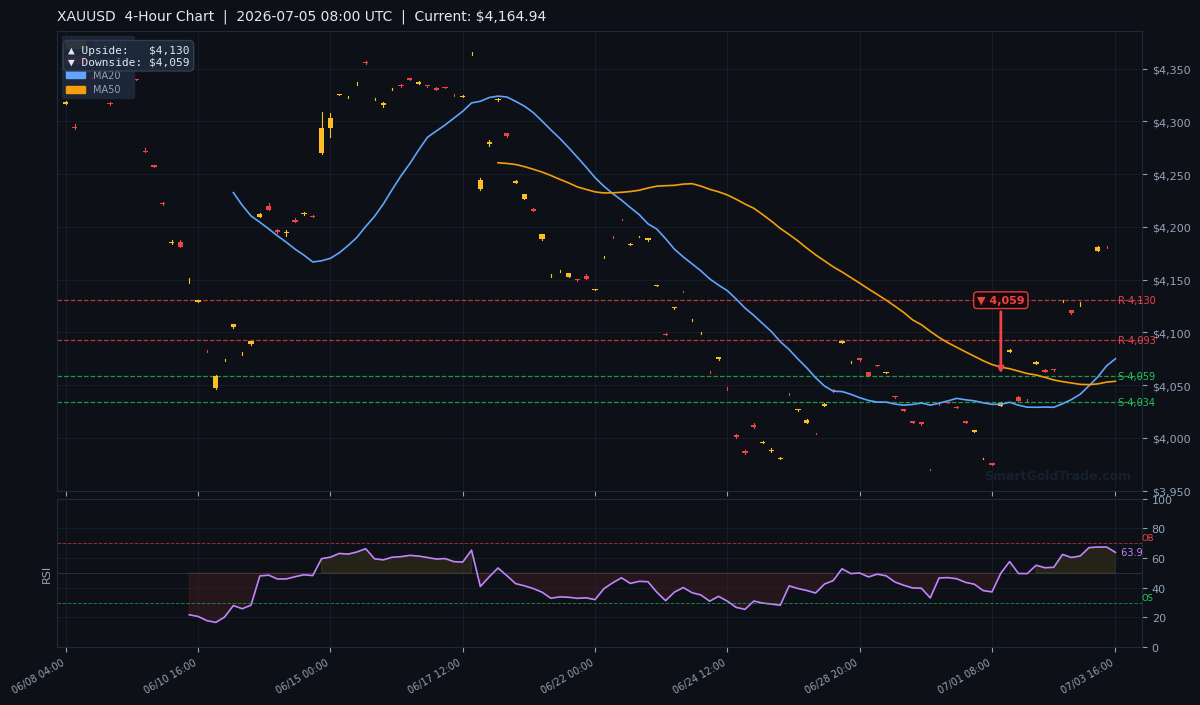
Gold ended the week at $4,174.54, firmly recapturing its 4‑hourly 20‑moving average ($4,075.08) and 50‑moving average ($4,053.74). The close above the psychological $4,150 mark reinforces the bullish momentum, though the metal remains below the long‑term 200‑moving average at $4,293.43.
This structure leaves the weekly bias tilted cautiously bullish, underpinning a positive gold price forecast next week. However, the $4,200–$4,293 zone must be conquered to confirm a trend change.
Gold Price Forecast Next Week: Economic Calendar & Gold Impact
A busy US‑centric calendar will steer gold prices this week. The FOMC minutes and producer inflation data headline a schedule that could either extend the post‑NFP rally or revive dollar strength. Below we detail day‑by‑day expectations and the likely gold reaction.
| Day | Event | Forecast | Previous | Gold Impact |
|---|---|---|---|---|
| Mon, Jul 06 | US ISM Services PMI (Jun) | 53.0 | 52.8 | Beat → hawkish, gold under pressure; miss → dovish, gold bid |
| Tue, Jul 07 | No high‑impact | — | — | Technical flows dominate |
| Wed, Jul 08 | FOMC Meeting Minutes | — | — | Hawkish minutes → bearish; dovish tone → bullish breakout |
| Thu, Jul 09 | US Weekly Jobless Claims | 220K | 215K | Higher claims → gold positive; lower claims → negative |
| Fri, Jul 10 | US PPI (Jun) MoM | 0.1% | 0.2% | Hot PPI → hawkish reaction; cool PPI → gold rallies |
Monday’s ISM Services PMI sets the early tone. A print above 53.0 would restore confidence in the US economy, lifting the dollar and capping gold near $4,140. A miss below 52.8 could fuel the post‑NFP rally toward $4,200.
Wednesday’s FOMC minutes from the June meeting are the week’s highest‑risk event. If the minutes reveal broad support for further rate hikes, gold could slide toward $4,059—the 4‑hour pivot downside target. However, any dovish leanings would validate the soft‑landing narrative and drive XAU/USD above $4,207.
Thursday’s jobless claims and Friday’s Producer Price Index round out the week. A jump in claims or a soft PPI reading would reinforce the “Fed is done” thesis, while lower claims/hot PPI could spark a sharp corrective selloff.
This gold price forecast next week ultimately depends on whether the data stream reinforces the post‑NFP bullish break or stalls it. Traders need to watch for signals that either fuel a close above $4,185 or trigger a defensive retreat toward support.
Technical Analysis
Gold’s technical posture has shifted notably short‑term bullish. The metal closed above both the 4‑hour 20‑MA and 50‑MA, yet the 200‑MA continues to cast a bearish shadow from $4,293. This section unpacks every key indicator using live chart data.
Moving Average Structure
The exponential moving average alignment is a tale of two timeframes. The MA20 ($4,075.08) sits above the MA50 ($4,053.74) for the first time in weeks, generating a short‑term “golden cross” signal on the 4‑hour chart. Price at $4,174.54 is comfortably above both, confirming near‑term momentum.
However, the MA200 looms at $4,293.43. Until XAU/USD can reclaim that level, the long‑term trend remains bearish. A weekly close above $4,293 would flip the structural bias.
RSI and Momentum
The 14‑period Relative Strength Index on the 4‑hour chart reads 63.9—firmly in neutral territory but leaning bullish. It has not reached overbought conditions, so there is ample room for further upside without immediate exhaustion risk.
A push above 70 would signal strong momentum but also increase the probability of a short‑term pullback toward $4,139.
Key Support and Resistance Levels
Calculated from pivot analysis and the ATR(14) of $26.59, intraday and weekly levels are well‑defined.
- Immediate support (S1): $4,139.37
- Deeper support (S2): $4,097.28
- Initial resistance (R1): $4,182.58
- Strong resistance (R2): $4,207.82
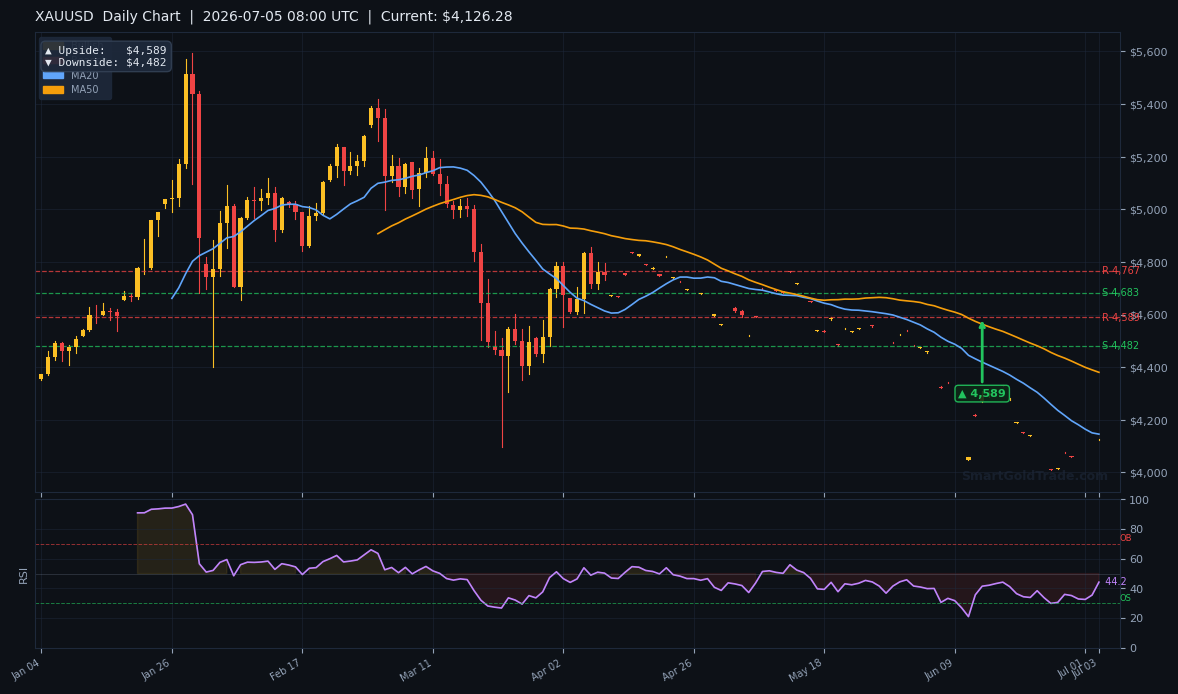
- Daily upside target (pivot): $4,589
- Daily downside target (pivot): $4,482
- 4‑hour upside pivot: $4,130 (pullback target if bearish)
- 4‑hour downside pivot: $4,059
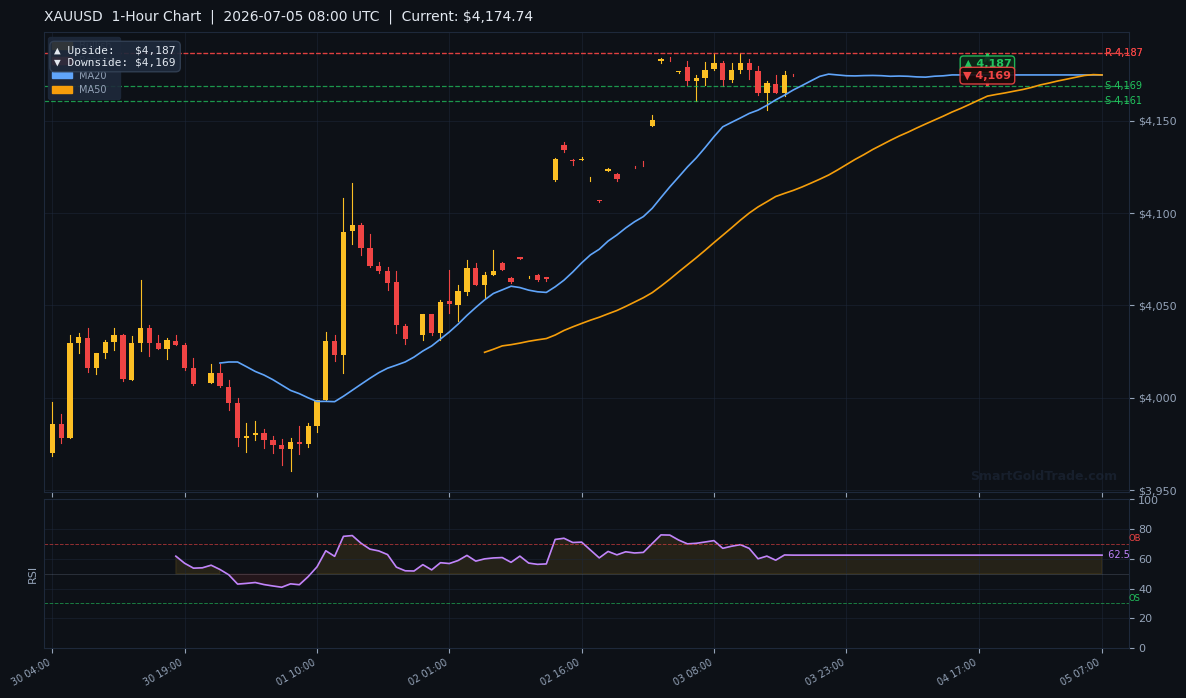
- 1‑hour upside pivot: $4,187
- 1‑hour downside pivot: $4,169
The ATR‑based weekly range projection places expected movement between $4,147 and $4,201, aligning with the S1‑R1 band. A break of R2 would open the path toward the extended daily target of $4,589.
Trading Scenarios This Week
Bullish Scenario (probability 55%)
A sustained move above the $4,182.58 R1, ideally triggered by a soft ISM Services print or dovish FOMC minutes, would confirm the post‑NFP breakout. Entry is favored on a 4‑hour close above $4,185.
- Entry zone: $4,185–$4,192
- Immediate target: $4,207.82 (R2)
- Extended target: $4,589 (daily pivot)
- Stop loss: $4,130 (4‑hour upside pivot)
For precise real‑time entry points, professional gold trading signals provide daily setups aligned with this scenario.
Bearish Scenario (probability 35%)
If hawkish FOMC minutes or a hot PPI print re‑ignite rate‑hike fears, gold could break below S1 at $4,139.37. A decisive 4‑hour close under $4,135 would trigger the bearish play.
- Entry zone: $4,130–$4,139
- Target 1: $4,097.28 (S2)
- Target 2: $4,059 (4‑hour downside pivot)
- Stop loss: $4,185
Neutral / Range‑Bound Scenario (probability 10%)
Should the economic data produce mixed signals, gold is likely to oscillate between $4,139 and $4,185. In this environment, mean reversion strategies—selling near $4,182 and buying near $4,139—can exploit the two‑way action.
Traders who prefer an ethical execution framework can carry out these range trades on our interest‑free spot gold trading platform, which offers physical ownership and fractional lots.
Risk Factors to Watch
Any unexpected geopolitical flare‑up—particularly a worsening of the Iran standoff—could inject a sudden safe‑haven bid into the dollar and temporarily derail gold’s ascent. The $4,130 level is the critical invalidation mark for the bullish thesis; a daily close below it would shift the bias to neutral‑bearish.
Additionally, a sharply higher‑than‑expected PPI on Friday would revive the “higher‑for‑longer” narrative and expose the $4,059 level quickly. These risk factors mean the gold price forecast next week could shift abruptly, so reactive risk management and tight stop‑losses are essential throughout the week.
Key Takeaways
- Gold starts the week at $4,174.54 with a bullish short‑term structure after last week’s weak NFP.
- Immediate resistance stands at $4,182.58; a breakout brings $4,207.82 and the daily target of $4,589 into play.
- Support is layered at $4,139.37 and $4,097.28; a daily close below $4,130 invalidates the bullish outlook.
- The FOMC minutes and US PPI are the highest‑impact events this week, capable of producing outsized moves.
- RSI at 63.9 leaves room for upside, but a spike above 70 may signal a temporary pullback.
- The 200‑MA at $4,293.43 remains the gatekeeper for a long‑term trend shift; bulls must conquer it to sustain momentum.
Conclusion
XAU/USD enters the new week with momentum firmly on the side of the bulls, yet markets are forward‑looking and the FOMC minutes could quickly rewrite the narrative. Our base case targets a test of $4,207.82, with a breakout opening the door to $4,589. That said, our gold price forecast next week remains conditional on holding above $4,139.
The most critical level to monitor is $4,182.58—a daily close above that resistance would confirm the break and attract trend‑following capital. On the downside, a failure to hold $4,139.37 would expose $4,059 and shift the medium‑term bias.
Whether you’re trading the volatility or seeking portfolio protection, now is a moment to stay disciplined and data‑driven. If you’re considering adding physical gold to your holdings, explore our range of certified coins and bars at our gold store.
Frequently Asked Questions
- What is the gold price forecast for next week?
- The forecast leans cautiously bullish above $4,139.37. A break above $4,182.58 targets $4,207.82 and potentially $4,589, while a drop below $4,130 could send gold toward $4,059.
- Will XAU/USD break the $4,200 level this week?
- A close above $4,182.58 would be the first step. With supportive US data or dovish Fed minutes, a run past $4,200 and toward $4,207.82 is highly probable.
- What are the key support levels for gold right now?
- The first line of defense is $4,139.37, followed by $4,097.28. A daily close below $4,130 would signal a deeper correction toward the 4‑hour pivot at $4,059.
- Is gold overbought at current prices?
- No. The 4‑hour RSI sits at 63.9, comfortably in neutral territory. Gold has room to rally further before reaching overbought conditions above 70.
- How will the FOMC minutes affect gold prices?
- Hawkish minutes that stress further rate hikes would pressure gold, likely pushing it below $4,139.37. Dovish minutes that hint at a pause could fuel a breakout above $4,207.82 and target $4,589.
Risk Disclaimer: Trading Gold (XAU/USD) carries significant risk of loss and is not suitable for all investors. This content is for informational purposes only and does not constitute financial advice. Always conduct your own research and trade responsibly.