The gold price is holding near $4,130.35 in a thin Asian session, and the tape feels heavier than the headline number suggests. Price sits below every major moving average on the hourly chart, and the daily open at $4,143.54 is already -0.32% in the red. Friday's softer Nonfarm Payrolls report briefly lifted bullion, but that bounce faded fast as long-end Treasury yields pushed to levels not seen since 2002.
That is the tension traders are dealing with right now. A weaker labour market cuts the odds of an October Fed hike, yet the bond market is doing the tightening instead. With liquidity thin and no tier-one data due in this session, the smart move is preparation, not pursuit.
Gold Market Overview
Macro Context
The US Dollar remains firm and the 10-year Treasury yield touched 5.349% on Monday, its highest since April 2002, before easing to 5.30%. The 30-year sits near 5.661%. Higher real yields raise the opportunity cost of holding a non-yielding asset, which is the single biggest headwind for the gold price this week.
Rate expectations have shifted sharply. Interest-rate swaps now price roughly a 22.7% chance of a Fed hike at the October gathering, down from about two-in-three in late September. That should be gold-supportive on paper, but markets are treating it as old news. The ISM Services PMI came in at 54.9, just under forecast, while the prices-paid component jumped to 74 — a reminder that inflation pressure has not disappeared.
Session Outlook
Asian hours bring thin books and exaggerated wicks. Expect the gold price to chop inside a $4,124 to $4,145 band unless a headline lands. The ADX at 15.9 confirms there is no trend to ride here, only a range to work. Do not chase breakouts in this liquidity — wait for the London open to confirm direction.
Technical Analysis
Moving Average Structure
The hourly EMA20 sits at $4,144.04 and the EMA50 at $4,152.71, both above spot. The EMA200 at $4,198.62 is far overhead, and price is trading below it — a clean bearish structure on the intraday timeframe. On the 4-hour chart the EMA200 is at $4,289.47, and on the daily it is $4,308.00. Every higher timeframe trend filter is pointing down.
RSI and Momentum
The RSI(14) reads 42.9, squarely in neutral territory with a mild bearish lean. The Stochastic is at 33.3/35.4, not yet oversold, so there is room for another leg lower before buyers get interested. MACD at -4.92 with a histogram of -0.08 shows momentum flattening rather than accelerating. Translation: this is a drift, not a flush.
Key Price Levels
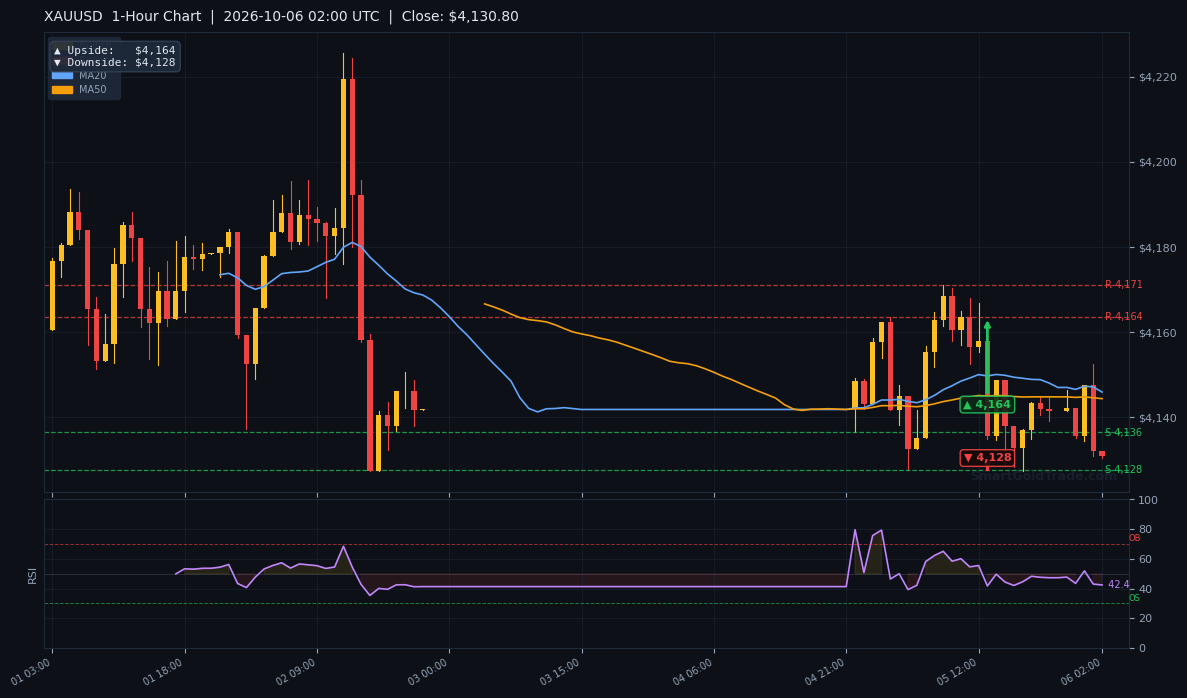
Support is stacked tight: S1 $4,125.28 and S2 $4,124.75, with the prior day low at $4,123.36 just beneath. Resistance begins at R1 $4,170.44 — which is also the prior day high — then R2 $4,187.68. The ATR(14) of $14.39 implies an expected hourly range of roughly 0.35%, so a move to either extreme today is a full session's work, not a five-minute event.
| Timeframe | Upside Target | Downside Target |
|---|---|---|
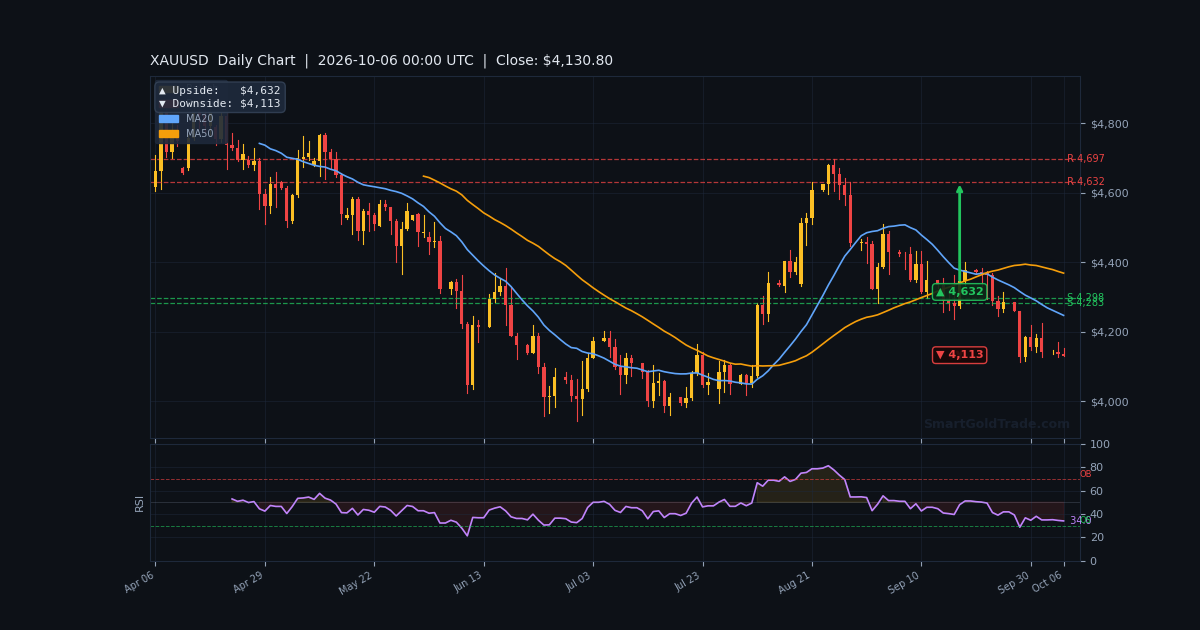
| Daily | $4,632 | $4,113 |
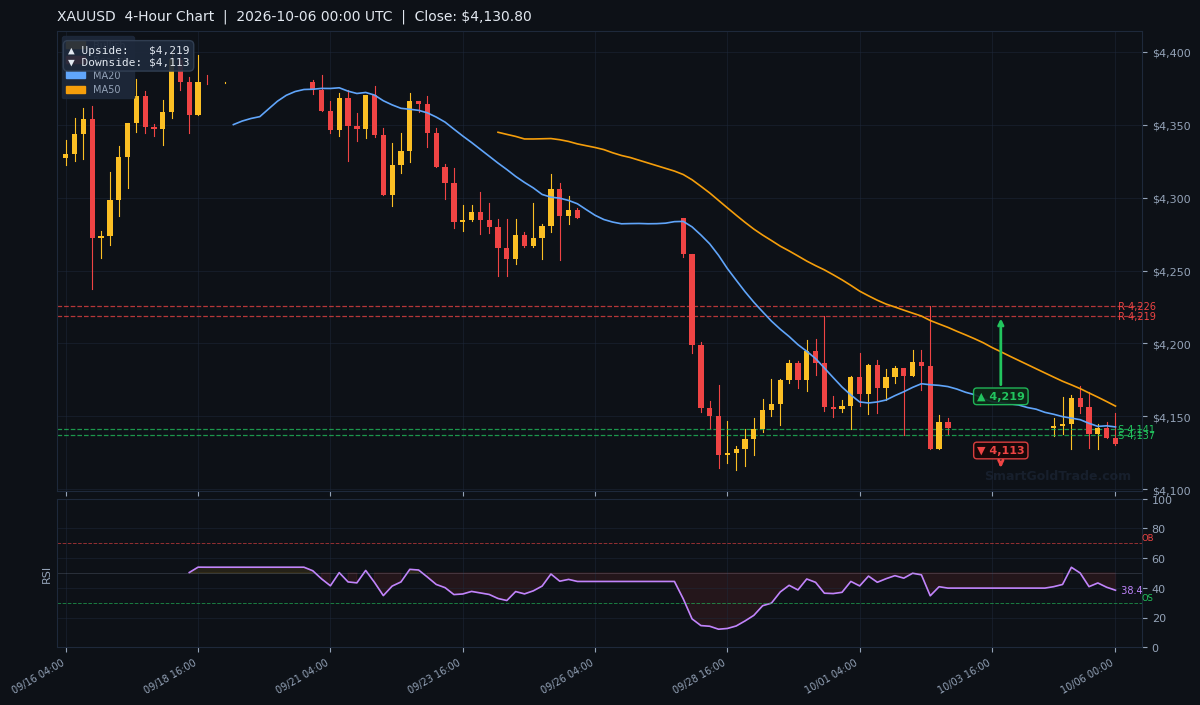
| 4-Hour | $4,219 | $4,113 |
| 1-Hour | $4,164 | $4,128 |
Fundamental Drivers
Veteran mining financier Frank Giustra told the Precious Metals Summit in Colorado that the general public has largely sat out this rally, leaving room for another leg higher while central banks keep buying dips. His framing — gold as a hedge against policy error — is worth keeping in mind against today's yield backdrop.
The counterweight is the bond market. OCBC analysts note that gold is still waiting for yields to turn, and that a softer labour report alone has not been enough to drive the next leg. Until long-end and real yields fall sustainably, rallies in the gold price will keep getting sold. Elevated oil prices add another layer of inflation risk that keeps the Fed cautious.
Key Event to Watch
The minutes of the September FOMC meeting are due on Wednesday. That release is the week's main catalyst and will shape how traders read the Fed's next move after last month's hike. A hawkish tone keeps pressure on gold; any hint of a pause could finally give bulls the yield relief they need.
Devil's Advocate
The bearish lean breaks if the gold price reclaims $4,144.04 on a closing basis and holds above the VWAP at $4,140.26. That would put the EMA20 and EMA50 back in play as support rather than resistance. A sustained push through $4,170.44 would invalidate the downside case entirely and open $4,187.68.
Equally, a sudden drop in long-end yields — perhaps triggered by a weak data surprise or a risk-off headline — could squeeze shorts fast in this thin liquidity. Size positions accordingly.
Trading Strategy for Asian Session
For sellers, the cleaner setup is a rally into $4,140–$4,144 that fails, targeting $4,128 first and $4,125 second. Place the stop above $4,152.71 — roughly one ATR beyond the EMA50 — to avoid getting wicked out by thin-book noise.
For buyers, patience pays. Wait for a test of $4,125.28 with a bullish rejection candle before considering longs, targeting $4,140 and then $4,164. The stop belongs below $4,123.36, the prior day low.
If you prefer to remove emotion from execution, an automated candlestick pattern detection tool can flag rejection signals at these levels in real time. For traders building long-term exposure instead, Shariah-compliant gold investment pools offer a different path entirely. Either way, position size must respect the $14.39 ATR — this is not a session for oversized bets.
Key Takeaways
- Gold price trades at $4,130.35, below all major hourly EMAs — bear structure intact.
- RSI at 42.9 is neutral, leaving room for another push toward $4,125 support.
- Resistance at $4,170.44 (R1 and prior day high) caps any meaningful bounce.
- ATR of $14.39 implies a 0.35% expected hourly range — trade small.
- October Fed hike odds sit near 22.7%, but yields, not rate bets, are driving gold now.
- Wednesday's FOMC minutes are the week's key catalyst for direction.
Conclusion
The gold price is drifting, not trending, and that distinction matters. With price at $4,130.35 below the EMA200 and momentum neutral, the path of least resistance remains mildly lower toward $4,125. But the ADX at 15.9 warns that conviction is absent on both sides.
Trade the range, respect the levels, and let London confirm direction before committing size. The real move likely waits for Wednesday's FOMC minutes.
Frequently Asked Questions
- What is the gold price right now?
- The gold price is $4,130.35 in the Asian session, down 0.32% from the daily open of $4,143.54.
- Is gold bullish or bearish today?
- Mildly bearish. Price sits below the EMA20 at $4,144.04 and EMA200 at $4,198.62, with RSI at 42.9.
- What are the key support levels for gold?
- Support sits at $4,125.28 (S1), $4,124.75 (S2) and the prior day low of $4,123.36.
- What resistance should traders watch?
- The first hurdle is $4,170.44 (R1), followed by $4,187.68 (R2). A close above R1 would flip the bias.
- What event could move gold this week?
- The September FOMC minutes on Wednesday. A hawkish tone pressures gold toward $4,125; a dovish one opens $4,170.
Trading Gold (XAU/USD) carries significant risk of loss and is not suitable for all investors. This content is for informational purposes only and does not constitute financial advice. Always conduct your own research and trade responsibly.