
Gold Price Hovers Near $4,615 – Is $4,667 the Final Support Before a Breakdown?
The gold price opened the European session at $4,615.45, extending last week's pullback after stronger-than-expected US PPI data. With bears firmly in control, the market now eyes the next major demand zone near the daily downside target of $4,667. This level has held twice in the past ten sessions and could determine whether the short-term trend flips bullish again. As liquidity rises during London hours, expect volatility to expand.
Gold Market Overview
Macro Context
The US Dollar Index (DXY) edged higher overnight, pressuring gold below its 200-period moving average. While the Federal Reserve maintained a neutral stance last week, markets are pricing in a 60% chance of a rate hold in June. Meanwhile, 10-year Treasury yields hover near 4.35%, reducing the appeal of non-yielding assets. Geopolitical tensions between Iran and the US remain elevated, providing a floor for safe-haven demand.
Session Outlook
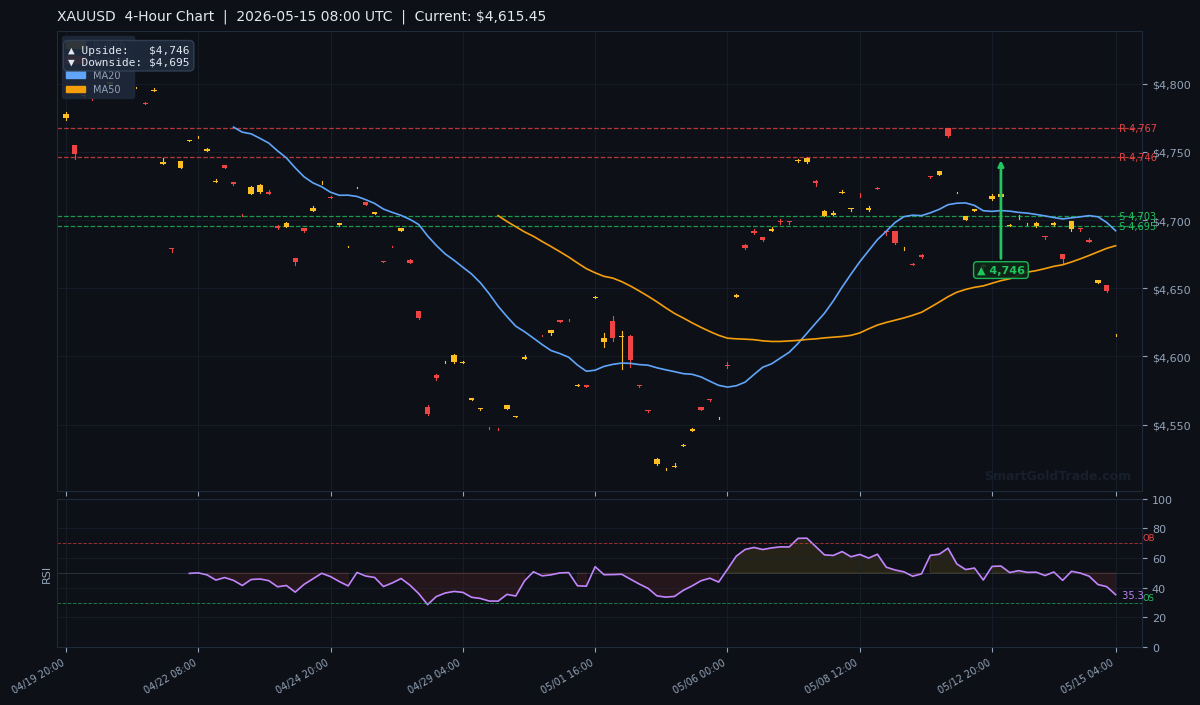
European session liquidity typically picks up between 08:00 and 12:00 UTC, and today we expect range expansion. The gold price is trading below all major moving averages on the H4 chart, a bearish configuration. However, the relative strength index (RSI) at 35.3 suggests room for a bounce before becoming oversold. Key intraday triggers include Eurozone GDP revisions and US housing data due later. A break below $4,695 could accelerate selling toward $4,667, while a reclaim of $4,713 would indicate buyer exhaustion.
Technical Analysis
Moving Average Structure
The 20-period MA sits at $4,692.20, the 50-period MA at $4,681.20, and the 200-period MA at $4,699.50. The MA20 is above the MA50, indicating short-term bullish momentum – yet the gold price is below all three averages. This divergence suggests the recent sell-off may be overextended, and a mean-reversion bounce toward the MAs is possible. However, sustained trading below the 200 MA warns of a deeper bear cycle.
RSI and Momentum
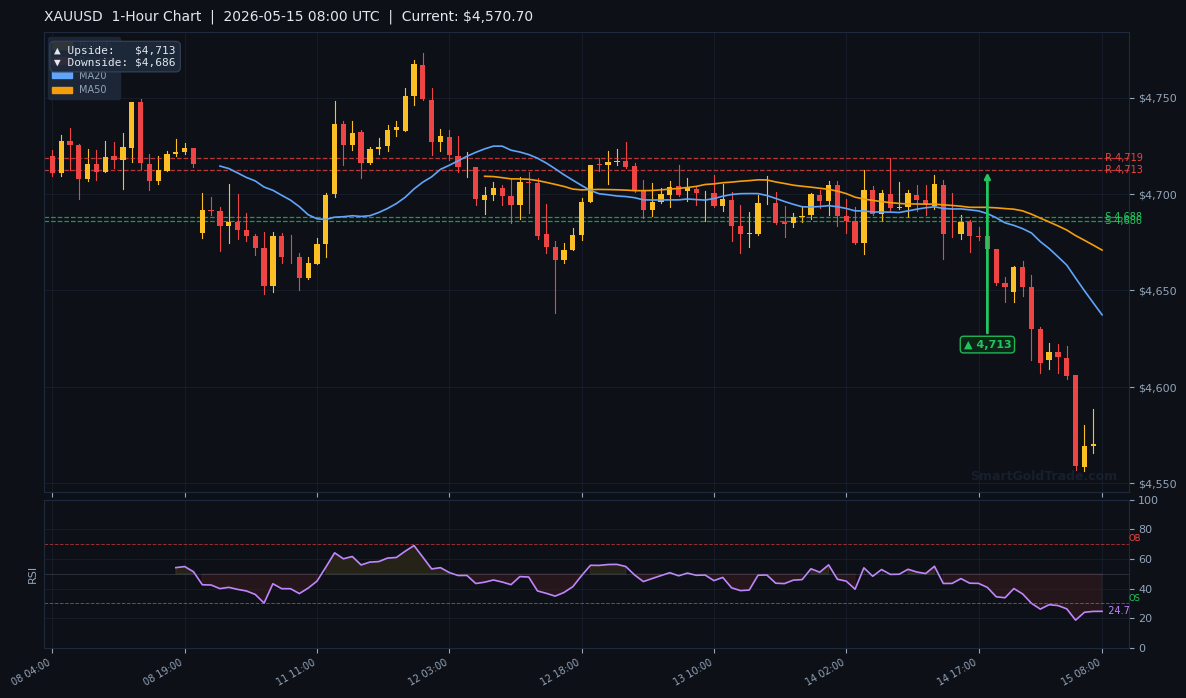
The RSI(14) reads 35.3, just above the traditional oversold threshold of 30. While not yet indicating a bounce, it confirms weakening bearish momentum. Historically, gold tends to consolidate or reverse when RSI approaches 32-35 during a downtrend. Watch for a bullish divergence on the 1-hour chart as a potential entry signal.
Key Price Levels
Support sits at $4,702.94 (S1) and $4,695.39 (S2), with an additional daily downside target at $4,667. On the upside, resistance is at $4,767.25 (R1) and $4,745.97 (R2), with a daily upside target at $4,838. The ATR(14) of $15.39 implies an expected intraday range of roughly $15-16. A break above $4,713 (1-hour upside target) could trigger a short squeeze toward the 4-hour resistance.
Fundamental Drivers
The main catalyst for this week's weakness is the stronger-than-expected US Producer Price Index (PPI) released last Thursday. The data showed a 0.4% month-over-month increase, core at 0.3%, reinforcing the narrative that inflation remains sticky. This lowered expectations for near-term Fed rate cuts, boosting the dollar and weighing on the gold price.
Key Event to Watch
The single most important event this week is Wednesday's US Retail Sales report for April. Economists expect a 0.2% month-over-month gain. A stronger print could push gold toward the $4,667 support, while a miss might trigger a recovery back above $4,700. Additionally, traders are watching Fed speeches for any shift in tone regarding the neutral stance.
Devil's Advocate
What if the gold price fails to respect the $4,667 support? A close below that level – especially on daily timeframe – would invalidate the current bounce scenario and open the door for a move toward $4,600 or even the $4,550 area, last seen in March. The key reversal level to watch is $4,713 (1-hour upside target). A break above that would signal that sellers are exhausted and flip the short-term bias to bullish.
Trading Strategy for European Session
For intraday traders, the preferred approach is to wait for a retest of the $4,695-$4,702 support zone. Enter long at $4,697 with a stop loss at $4,679 (below ATR from entry). Take profit targets: first at $4,713 (1-hour upside), second at $4,727. Risk-reward ratio is approximately 1:1.4. Alternatively, if the gold price breaks below $4,695 on heavy volume (above average tick count), a short entry to $4,667 becomes viable. Place stop at $4,710. For those seeking a fully Shariah-compliant approach, SmartGoldTrade offers interest-free spot gold trading. Alternatively, you can follow top traders automatically via copy trading to mirror experienced accounts.
Key Takeaways
- Gold price at $4,615.45 – below all major moving averages, bearish trend.
- Immediate support at $4,695.39 (S2); critical support at $4,667 (daily downside target).
- Resistance levels: $4,702.94 (S1), $4,745.97 (R2), and daily upside target $4,838.
- RSI at 35.3 – neutral but close to oversold, potential bounce if divergence forms.
- ATR of $15.39 implies ~$15 intraday range; adjust stops accordingly.
- US Retail Sales (Wednesday) is the key catalyst – a miss could fuel recovery above $4,700.
Conclusion
The gold price is at a make-or-break juncture. Bears have pushed it below every short-term moving average, but momentum indicators suggest exhaustion. The $4,667 level represents the last line of defense for bulls this week. A violation would signal a steeper decline, while a hold and bounce could retest the $4,700-4,745 zone. Trade with discipline, respect the levels, and watch retail sales closely.
Frequently Asked Questions
- What is the gold price today?
- The gold price is currently $4,615.45 during the European session on May 15, 2026.
- What are the key support levels for gold?
- Immediate support is at $4,695.39 (S2), with the major daily support at $4,667.
- What are the key resistance levels for gold?
- Resistance levels are $4,702.94 (S1), $4,745.97 (R2), and the daily upside target at $4,838.
- Is gold bullish or bearish right now?
- The trend is bearish as gold trades below the 20, 50, and 200-period moving averages. However, the RSI at 35.3 and EMA structure (MA20 > MA50) suggest a potential short-term bounce.
- What news could move gold this week?
- The US Retail Sales report on Wednesday is the key event. A strong number could push gold toward $4,667 support, while a weak number may trigger a recovery above $4,700.
Trading Gold (XAU/USD) carries significant risk of loss and is not suitable for all investors. This content is for informational purposes only and does not constitute financial advice. Always conduct your own research and trade responsibly.