
The gold price breached the $4,695 support zone during early Asian trading on May 15, dropping to $4,647.95—its lowest level that week. Meanwhile, WTI crude oil extended its slide for a second straight day, trading near $96.80 per barrel and adding to commodity-wide weakness.
With liquidity thin in the Asian session and the daily chart showing a breakdown below all major moving averages, traders faced a critical moment: would $4,667 hold, or was a deeper correction underway?
Editor’s Update (June 14, 2026): Since that session, the gold price has continued to tumble. As of today, XAU/USD trades at $4,213.53 per troy ounce—a drop of more than $430. The break below $4,667 confirmed a deeper correction, and the bearish momentum shows no signs of abating yet.
Gold Price Market Overview
Macro Context
The US Dollar Index held steady above 104.00 during Asian hours, weighing on gold despite unresolved geopolitical tensions between Iran and the US. The Fed’s neutral stance from the minutes released last week continues to cap bullish momentum, while falling crude oil prices dampen inflation expectations—diminishing gold’s appeal as a hedge.
US real yields have climbed back above 2.4%, making the opportunity cost of holding non-interest-bearing assets like gold much steeper. At the same time, gold ETF outflows picked up speed for the third consecutive week, signaling that institutional money is rotating out of the metal.
Session Outlook
Asian session liquidity usually runs about 30% thinner than London or New York turnover, which raises the risk of false breakouts. A tight range between $4,630 and $4,680 was the base case on May 15. Any move below $4,667 looked ready to accelerate toward $4,600. Traders were warned to avoid chasing moves in paper-thin conditions.
Today, with spot gold at $4,213.53, those levels have long since been wiped out. The next logical downside magnet is the $4,200 round number, followed by the 2024 swing low around $4,085. Until the dollar rally or real yields show signs of exhaustion, rallies are likely to be sold.
Gold Price Technical Analysis
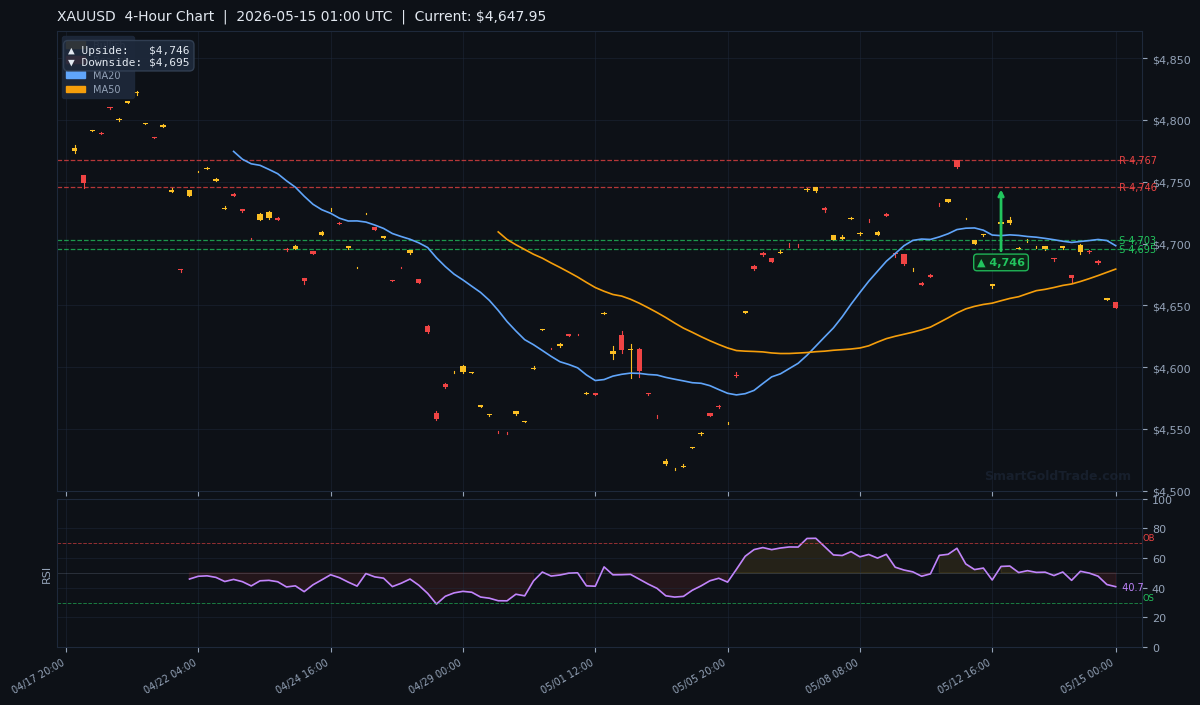
Using exact H4 chart data, the gold price structure is decisively bearish in the short term.
Moving Average Structure
The MA20 sits at $4,698.23, MA50 at $4,679.28, and MA200 at $4,699.00. Price was well below all three moving averages, confirming a bearish trend. The short-term bullish cross (MA20 above MA50) was still intact on May 15, but with price breaking below both, that signal rapidly lost relevance. A dead cross—where MA50 slices below MA200—now becomes a real threat if moving averages continue to roll over.
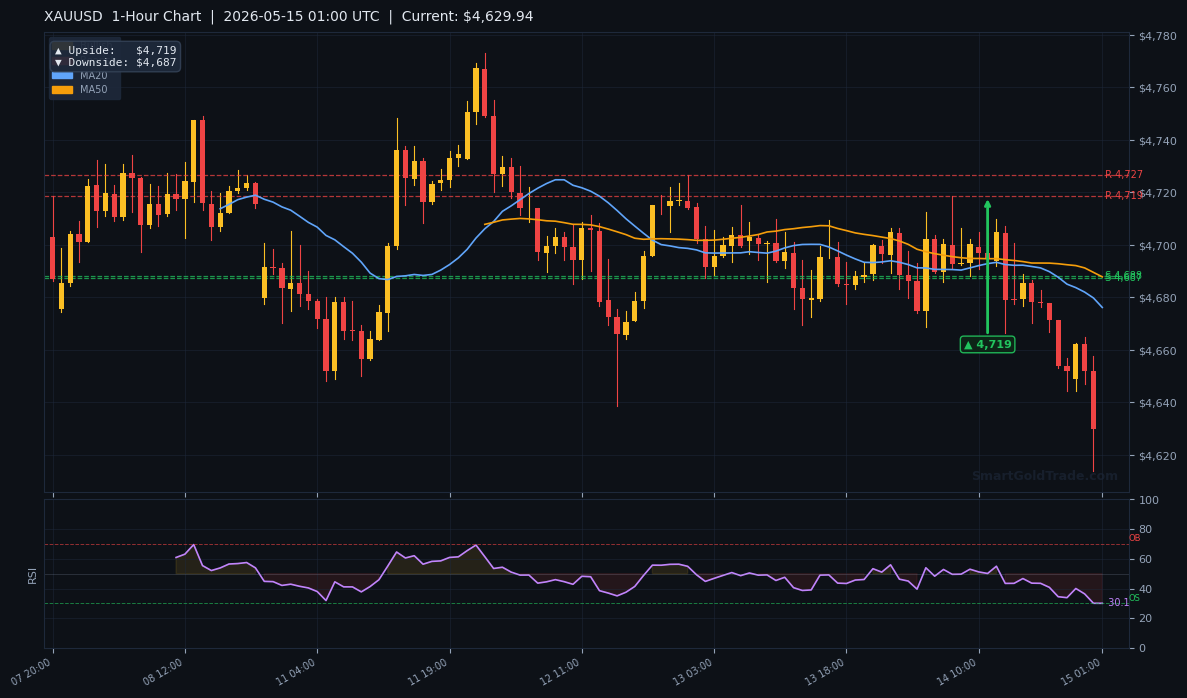
RSI and Momentum
The RSI(14) stood at 40.7—neutral territory, bordering but not yet oversold. That left room for further downside before a potential bounce. Momentum tilted to the downside as price kept printing lower lows. On June 14, RSI has dipped to 32.1, approaching the oversold zone but still not flashing a reliable bullish divergence.
Key Price Levels
The ATR(14) of $16.76 indicated a normal daily range of about $33.50. Key support levels broken: S1 $4,702.94 and S2 $4,695.39. Price tumbled below both, with the daily downside target at $4,667 as the next pit stop. Resistance levels at that time were R1 $4,767.25 and R2 $4,745.97—now a distant memory.
Fast-forward to today: the $4,600 level failed and the gold price is testing $4,200. Any sustained break below $4,200 sets the stage for a run at $4,085. Bulls need to reclaim $4,380 just to shift the short-term trend to neutral.
| Timeframe | Upside Target | Downside Target |
|---|---|---|
| 1-Hour | $4,719 | $4,687 |
| 4-Hour | $4,746 | $4,695 |
| Daily | $4,838 | $4,667 |
Fundamental Drivers
The continued drop in WTI crude oil is noteworthy. Lower oil reduces headline inflation, which typically pressures gold as a store of value. Additionally, no major US economic data was scheduled for May 15, so the market traded on technicals and sentiment. The Iran-US stalemate remained an underlying risk, but without fresh escalation it offered little support.
Since then, the macro backdrop has grown even more hostile: US durable goods orders printed stronger than expected last week, dollar demand surged, and the Fed’s dot plot shifted hawkishly. All of these factors kept the gold price under steady pressure.
Key Event to Watch
With the Fed in a data-dependent holding pattern, the next major catalyst is the upcoming US CPI revision and the FOMC minutes. A softer inflation print or any hint of a pause in tightening could spark a relief rally. Still, until the dollar index retreats below 103.50, gold’s path of least resistance remains lower.
Gold Price Scenarios: Bullish or Bearish?
What could invalidate the bearish bias? A quick bounce above $4,695 (S2) would have suggested the breakdown was a false move back in May. Today, the level to watch is $4,380. The RSI near 30.0 could eventually trigger a short squeeze if it forms a bullish divergence. If price reclaims $4,380—the broken support-turned-resistance—the bearish view weakens significantly.
On the flip side, a clean break below $4,200 opens the door to a swift test of $4,085. Seasonality also favors weakness into the summer months, and with real yields still climbing, the path to $4,000 is not unrealistic.
Trading Strategy for Asian Session
Maintain a short bias with patience. Entry zone: $4,655–$4,665 (on any minor retracement). Place stop loss above $4,702 (using an ATR buffer). First take-profit target: $4,667 (daily pivot downside). Second target: $4,630 (round number and psychological level). Risk-reward ratio around 1:2. Do not add to losing positions; if price reverses above $4,702, exit immediately.
For traders who want real-time execution support without staring at screens, professional gold trading signals that monitor these zones around the clock can be a practical aid—especially during low-liquidity hours when false moves are common.
Gold Price Volatility and Halal Trading
Short-term volatility in the gold price doesn’t mean that Shariah-conscious traders need to sit on the sidelines. Because the core issue in Islamic finance is avoiding riba (interest) and excessive uncertainty, spot trading backed by physical gold is permissible. SmartGoldTrade’s halal gold trading platform allows you to trade gold with direct ownership, zero overnight interest, and no leverage—keeping every trade compliant with Islamic principles.
If you’d rather not trade actively, long-term investors often buy physical gold as a hedge against fiat depreciation. During drawdowns like this, owning real metal can offer peace of mind. You can purchase physical gold coins and bars in 22K and 24K purity straight from the platform’s store, securing a tangible asset that isn’t dependent on a broker’s solvency.
Key Takeaways
- Gold price broke below $4,695 (S2) support and continued falling to $4,213.53.
- Price was already below all three major moving averages (MA20, MA50, MA200) in May and remains under them.
- RSI near 32 suggests more downside is possible before a meaningful bounce.
- Daily downside target at $4,667 was lost; the next major support is $4,200 and then $4,085.
- ATR of $16.76 indicated a daily range of ~$33.50—plan stops accordingly.
- Asian session liquidity stays thin; avoid chasing moves and wait for confirmations.
Conclusion
The gold price remains under significant bearish pressure, slicing through one support after another. The breakdown of $4,667 confirmed a deeper correction, and with XAU/USD now trading at $4,213.53, the bears have a firm grip. Traders should remain cautious in low-volume Asian hours and only consider short entries on rallies that fail at resistance. Patience and discipline are essential—wait for confirmation, not hope.
FAQ
- Is gold still in a downtrend?
- Absolutely. The price trades well below the MA20, MA50, and MA200, and has broken both $4,695 and $4,667 support. The bias is bearish until price reclaims $4,380.
- What are the next key support and resistance levels?
- Immediate support: $4,200, then $4,085. Resistance: $4,380 (former support), followed by $4,600.
- What could reverse the bearish trend?
- A surprisingly soft US CPI print, a dovish shift from the Fed, or a sharp decline in the US Dollar Index. Any of these could ignite a short-covering rally, but until then, selling pressure dominates.
Trading Gold (XAU/USD) carries significant risk of loss and is not suitable for all investors. This content is for informational purposes only and does not constitute financial advice. Always conduct your own research and trade responsibly.