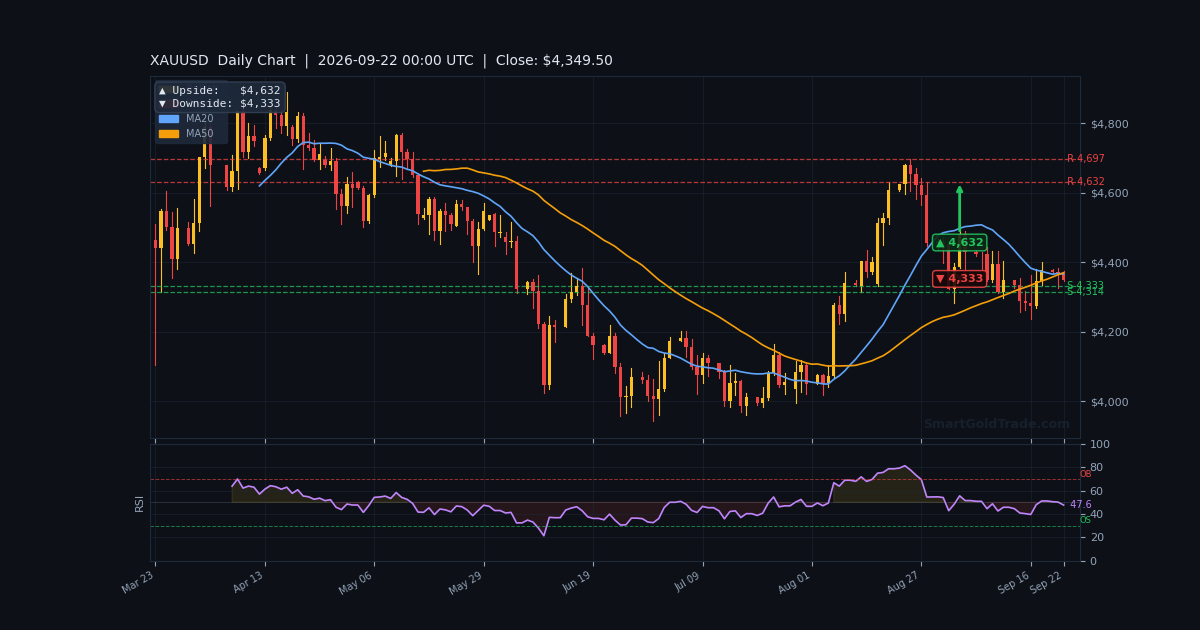
The gold price is holding near $4,344.40 in a quiet Asian session, pinned below every major moving average on the hourly chart. Buyers haven't gone away — they've simply stopped paying up after last week's hawkish Federal Reserve decision.
That decision was a quarter-point hike to the 3.75%–4.0% range, the first increase since 2023. It landed on September 16, and it's still the single biggest force in this market.
Since then, the metal has drifted sideways, shedding 0.72% on the week. With Tokyo still thin and London hours away, this session is about preparation, not prediction.
Gold Market Overview
Today's tape is a waiting game. The gold price opened the day essentially flat and has done very little since. That's not a coincidence — it's what a market looks like when conviction is split.
Macro Context
The dollar is the pressure point. The US Dollar Index pushed to a more than two-month high on Friday, and gold has felt every tick of it.
St. Louis Fed President Alberto Musalem said on Monday that more hikes may be needed, warning inflation could stay above 2% for 18 months without further tightening. Chicago Fed President Goolsbee went further, arguing that if inflation is coming from overheated demand, the increases should be bigger and come sooner.
Markets are listening. CME FedWatch now prices roughly a 90.3% chance of a December hike, and October odds have climbed to about 53% from 40% straight after the September decision. Higher rates raise the opportunity cost of holding a metal that pays no yield.
Two forces are pulling the other way. US-Iran diplomacy hopes are building ahead of the UN General Assembly, and gold ETF holdings sit at a six-month high with central banks still buying. That's a floor, not a launchpad.
Session Outlook
Asian liquidity is thin, and ADX at 12.1 confirms a market with no trend to speak of. Expect a contained range between $4,342.20 and $4,380.90 unless a headline lands.
The triggers to watch are any Fed speaker comments later today and the first headlines out of the UN General Assembly. In thin volume, a single remark can move price further than the fundamentals justify. Don't chase it.
Technical Analysis
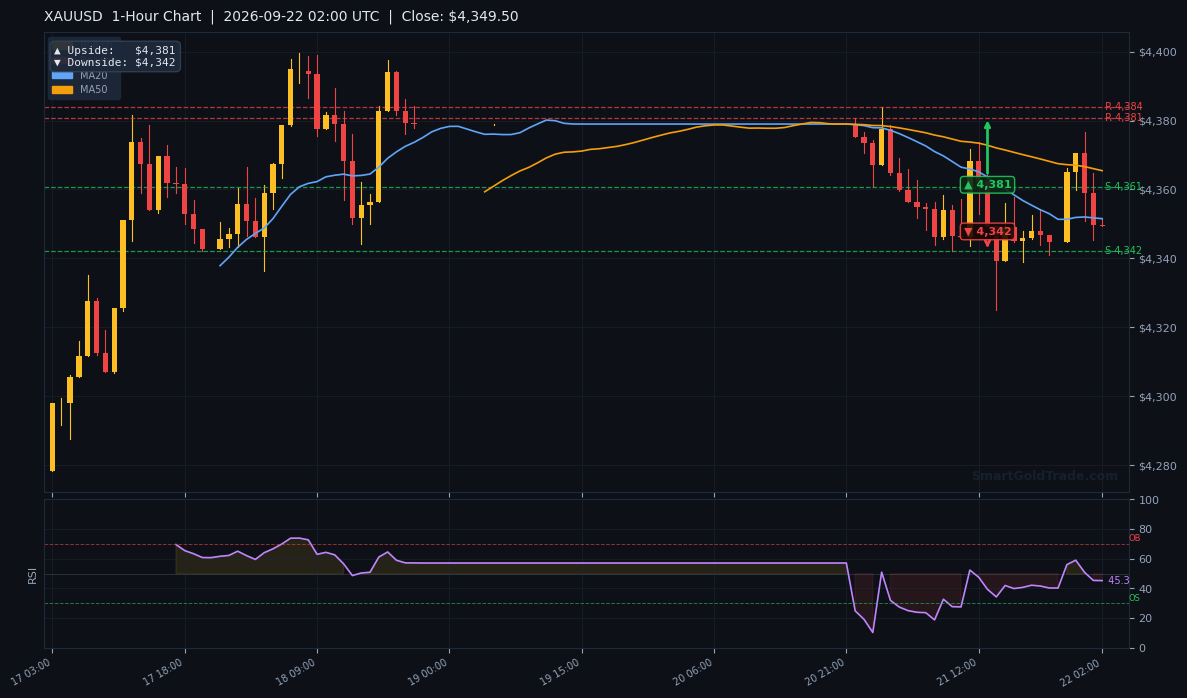
Every number below comes straight from the H1 chart at the 02:00 UTC bar close. Nothing here is estimated.
Moving Average Structure
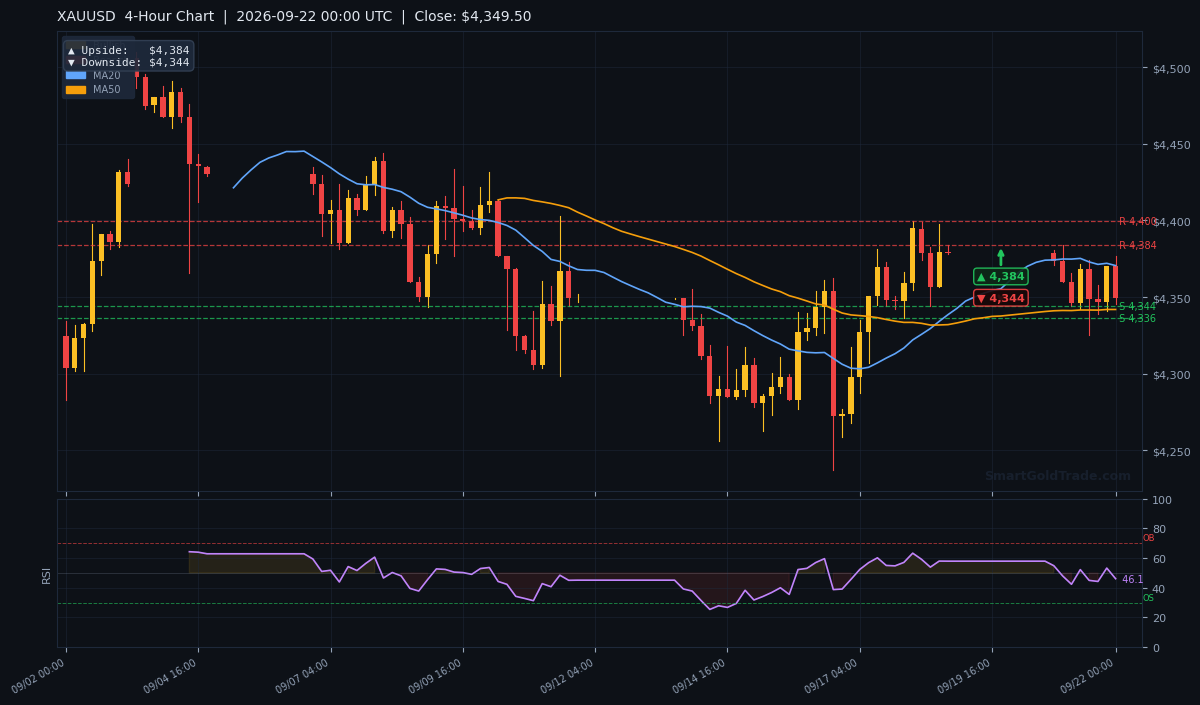
The hourly picture is bearish. MA20 sits at $4,351.26 and MA50 at $4,365.36, with price at $4,344.40 below both. That MA20-below-MA50 cross is a classic short-term bearish signal.
That cluster between $4,351 and $4,365 is now the first real hurdle. On the higher timeframes the picture softens, but the daily structure remains far below price and intact.
RSI and Momentum
RSI(14) reads 42.6 — neutral, no oversold bounce fuel and no overbought exhaustion. There's no strong selling pressure either, which keeps the door open for a range bounce.
The lack of momentum is the more interesting signal. The market is losing downside momentum, not gaining it, even as price sits below the moving averages.
Key Price Levels
Support: S1 $4,342.20. Resistance: R1 $4,380.90 and R2 $4,383.90. The prior day's low remains the deeper line in the sand.
ATR(14) is $14.04, about 0.32% of price. That's your realistic hourly range — roughly $4,330 to $4,358 if the session stays quiet.
| Timeframe | Close | RSI | MA50 |
|---|---|---|---|
| H1 | $4,344.40 | 42.6 | $4,365.36 |
| H4 | $4,344.40 | 42.6 | $4,365.36 |
| D1 | $4,344.40 | 42.6 | $4,365.36 |
Fundamental Drivers
The dominant story is the Fed's hawkish turn. Last week's hike was unanimous, and Chair Warsh framed it as removing a dose of accommodation. The dot plot pointed to at least one more increase.
Musalem's Monday comments — that policy may still be stimulating the economy and that incremental hikes may be needed — reinforced the higher-for-longer narrative. ING analysts flagged tighter monetary policy as a continuing headwind for bullion, while noting ETF holdings at a six-month high and steady central bank buying should limit the downside.
Geopolitics is the counterweight. Iran's President Masoud Pezeshkian is due at the UN General Assembly today, and President Trump said he'd probably be open to meeting him. That prospect knocked WTI down over 3.60% and softened the safe-haven bid. Less Middle East premium is a mild negative for gold, but a diplomatic breakthrough would also cool the inflation impulse behind the Fed's hawkishness.
Key Event to Watch
The most important item this week is Tuesday's Fedspeak and the UN General Assembly headlines. Any official echoing Goolsbee's urgency lifts October hike odds above 53% and pressures the gold price toward $4,342.20. A softer tone does the opposite.
Devil's Advocate
The bear case rests entirely on the Fed. If Musalem and Goolsbee represent the committee's center rather than its hawkish wing, the dollar keeps grinding higher and gold loses the $4,342 shelf.
The invalidation level is clear: a sustained hourly close below S1 $4,342.20 opens the prior day's low. That would flip the bias decisively bearish.
On the other side, a close above $4,351.26 would neutralize the bear structure and put R1 $4,380.90 back in play. The improving momentum says that scenario isn't as remote as the moving averages suggest.
Trading Strategy for Asian Session
This is a range session, so trade it like one. The setup that offers the cleanest risk is a long from the support shelf at $4,342.20.
Place the stop below the shelf at $4,334.00, roughly half an ATR beneath entry. That keeps risk near $8 per ounce while the first target at R1 $4,380.90 offers about $36. A second target at R2 $4,383.90 extends the reward to roughly 4.5 times risk.
If price instead rallies into $4,380.90 without a pullback, don't buy the breakout. That level coincides with the MA20 and MA50 cluster, and thin Asian volume produces false breaks there routinely.
Position size should be smaller than usual. With ADX at 12.1 and ATR at $14.04, moves will be small and stops will be tested by noise. Traders who prefer to follow analyzed levels rather than watch every tick can compare approaches through professional gold trading signals.
For those building a longer-term allocation rather than trading the range, Shariah-compliant gold investment pools offer a different route to the same asset without intraday exposure.
Key Takeaways
- The gold price trades at $4,344.40, below the hourly MA50 at $4,365.36 — bear structure intact.
- RSI at 42.6 and ADX at 12.1 confirm a neutral, range-bound market with no trend edge.
- Support rests at $4,342.20; resistance sits at $4,380.90 and $4,383.90.
- ATR of $14.04 implies a session range of roughly $4,330 to $4,358.
- December hike odds near 90.3% and October odds at 53% keep the dollar bid and cap gold rallies.
- ETF holdings at a six-month high and central bank buying limit the downside below $4,342.
Conclusion
The bias this session is neutral-to-soft. The gold price sits below every short-term moving average, the dollar is firm on hawkish Fed rhetoric, and momentum indicators show no urgency in either direction.
That combination argues for patience over action. The level that matters is $4,342.20. Hold it, and the metal grinds sideways into the London open with a shot at $4,380.90. Lose it on an hourly close, and the prior day's low comes into view.
Watch the Fed speakers and the UN headlines today. In a market this thin, they'll decide which of those two paths opens first.
Frequently Asked Questions
- What is the gold price right now?
- The gold price is $4,344.40 at the 02:00 UTC hourly close, down 0.72% on the week and essentially flat on the day.
- Is gold bullish or bearish today?
- Neutral-to-soft. Price is below the hourly MA50 at $4,365.36, but RSI at 42.6 shows no strong selling pressure either.
- What are the key support and resistance levels?
- Support sits at $4,342.20. Resistance sits at $4,380.90 and $4,383.90.
- Will the Fed hike again in 2026?
- CME FedWatch prices roughly a 90.3% chance of a December increase and about 53% for October, after September's hike to 3.75%–4.0%.
- What is the expected trading range for this session?
- With ATR(14) at $14.04, the realistic hourly range is roughly $4,330 to $4,358 unless a headline breaks it.
Trading Gold (XAU/USD) carries significant risk of loss and is not suitable for all investors. This content is for informational purposes only and does not constitute investment advice. Past performance is not indicative of future results.