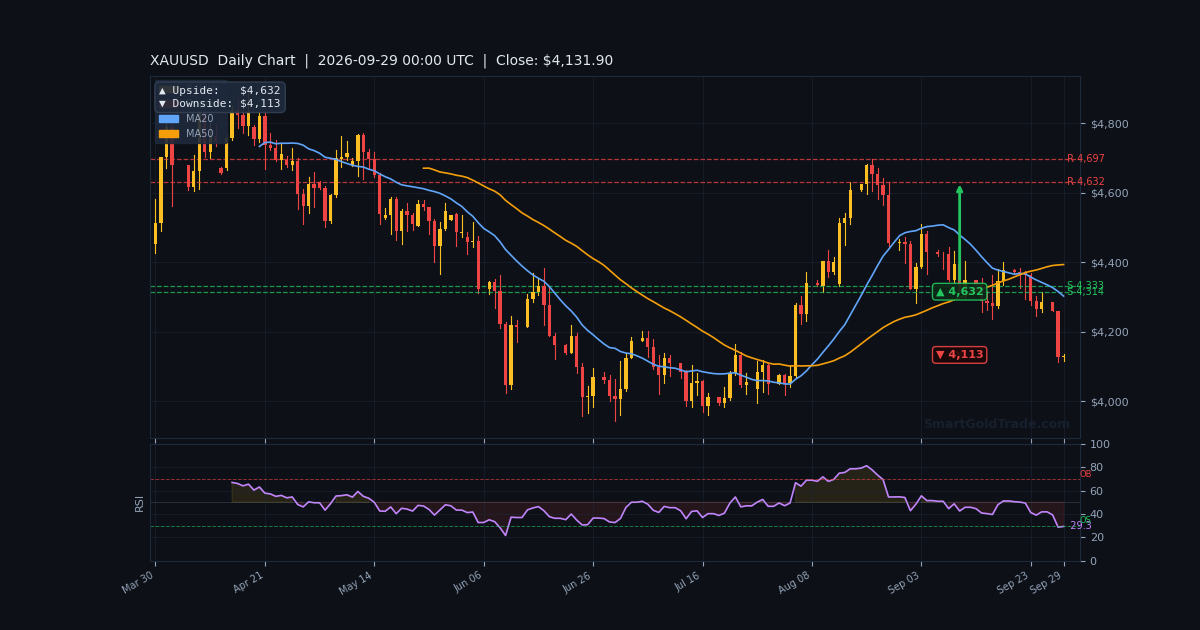
The gold price is holding near $4,135.44 in early Asian trade, but the tape is fragile. Friday's session saw the metal tumble over 4% to $4,110, its lowest since August 5, as surging oil and Treasury yields squeezed non-yielding assets.
That move matters because it came on the back of a hawkish Fed repricing. Money markets now assign roughly a 70% probability to another rate hike in October, following the central bank's first increase in three years earlier this month.
With liquidity thin and no major US data due until later this week, the Asian session is about one thing: whether $4,110.87 holds or breaks. Here is how to prepare.
Gold Market Overview
Macro Context
The macro backdrop remains hostile for the gold price. Benchmark 10-year US Treasury yields touched their highest since June 2007 before paring gains, and rising real yields continue to erode the case for holding a non-interest-bearing asset.
Oil is the second pressure point. Prices climbed again after Iranian officials said only diplomacy can resolve their standoff with the US and Israel, following President Trump's rejection of a proposal to reopen the Strait of Hormuz. Higher energy costs feed inflation, which in turn hardens expectations that the Fed must tighten further.
Fed Governor Lisa Cook added to the hawkish tone on Monday, saying she expects continued inflation pressure from AI-driven demand and the Middle East conflict. She noted the Fed has limited tools if AI disrupts the labour market, since cutting rates could fuel inflation.
Session Outlook
Asian hours offer the thinnest liquidity of the day, and that cuts both ways. Moves can extend further than fundamentals justify, then snap back when Europe opens. Expect a likely working range between $4,110 and $4,175 unless a headline lands.
The key trigger to monitor is any shift in US-Iran rhetoric. A de-escalation signal would cool oil, ease yield pressure and give gold room to breathe. Escalation does the opposite.
Technical Analysis
Moving Average Structure
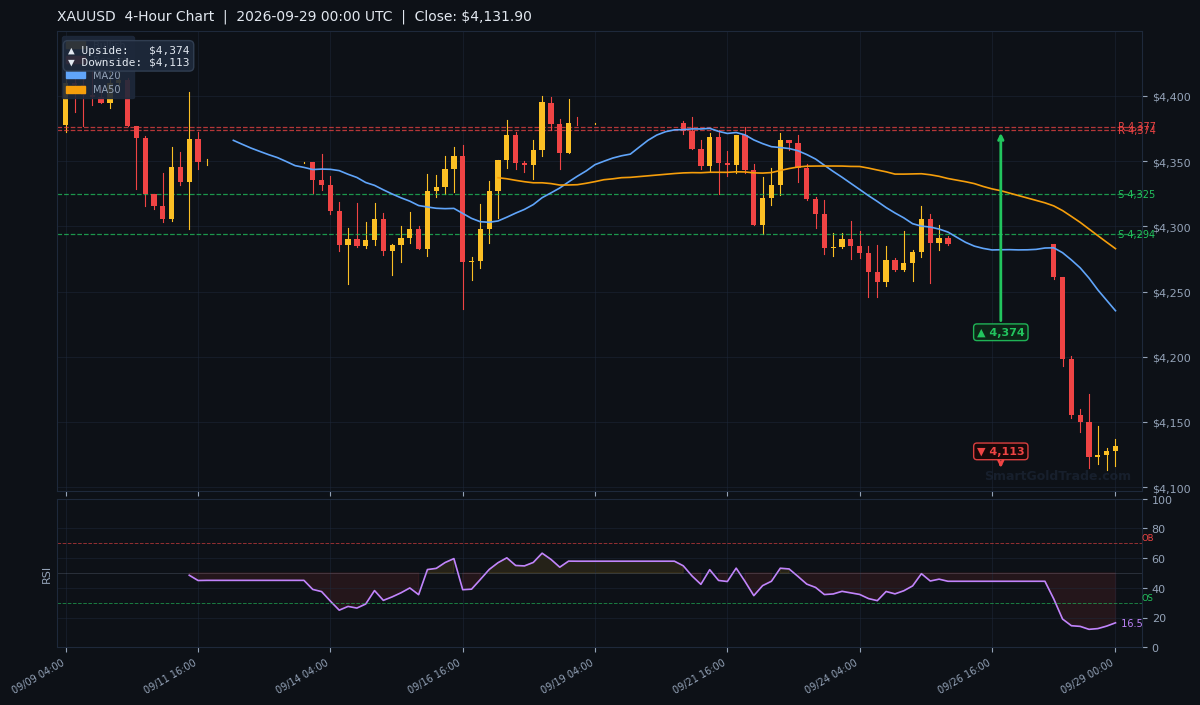
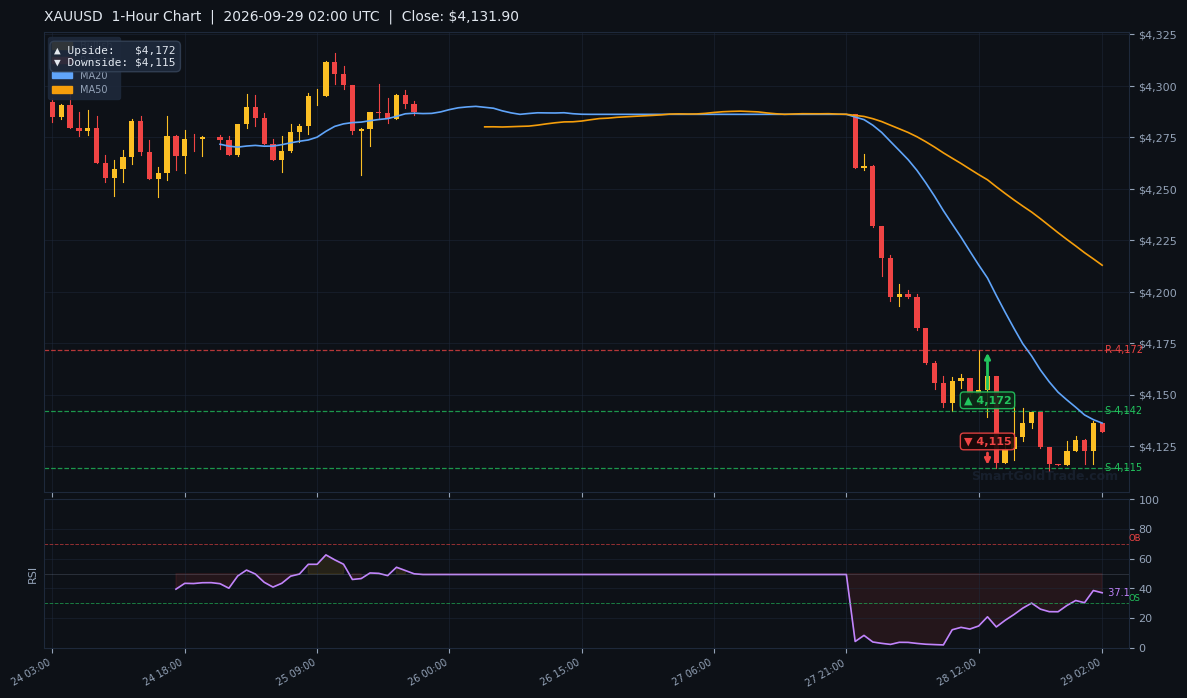
The trend is unambiguously bearish on the hourly chart. Price at $4,135.44 sits below the EMA20 at $4,148.95, below the EMA50 at $4,197.57, and well beneath the EMA200 at $4,282.03. That stacked alignment — shorter averages below longer ones — confirms sellers control the structure.
On the higher timeframes, the picture is the same. The H4 EMA200 rests at $4,334.25 and the D1 EMA200 at $4,315.69, both far above spot. Until price reclaims at least the EMA50, rallies are counter-trend.
RSI and Momentum
Momentum is weak but not yet washed out. RSI(14) reads 39.4 — neutral territory, but leaning bearish. The H4 RSI at 28.4 and D1 RSI at 36.3 show deeper oversold conditions on higher timeframes, which is why the sell-off has paused rather than accelerated.
The Stochastic sits at 26.6/21.0, also oversold, while MACD at -27.02 with a positive histogram of +3.60 hints that downside momentum is decelerating. Translation: the market is stretched, but not reversing.
Key Price Levels
Support clusters at $4,110.87 (S1 and the prior day's low), with the Bollinger lower band at $4,104.75 just beneath. A clean break there exposes the psychological $4,000 zone that bearish analysts are targeting.
Resistance begins at the Bollinger middle band of $4,140.13, then the EMA20 at $4,148.95. The 1-hour pivot upside target sits at $4,172, with R1 far higher at $4,288.56.
With ATR(14) at $17.66, the expected hourly range is roughly 0.43% of price. ADX at 44.9 confirms a strong trending environment — respect the direction until it breaks.
| Timeframe | Upside Target | Downside Target |
|---|---|---|
| 1-Hour | $4,172 | $4,115 |
| 4-Hour | $4,374 | $4,113 |
| Daily | $4,632 | $4,113 |
Fundamental Drivers
Two forces are doing the damage. First, the yield story: Deutsche Bank analysts noted gold fell 2.14% last week as higher real and nominal yields pressed on precious metals. The modest Friday rebound did little to change that.
Second, the oil story. Rising crude on US-Iran stalemate keeps inflation front and centre. As Tim Waterer of KCM Trade put it, high bond yields and high oil prices remain a thorn in gold's side.
Silver tells the same story, dropping toward $60.60 after over 5% losses the prior day. When both metals fall together, it is a macro repricing, not a gold-specific event.
Key Event to Watch
The US Personal Consumption Expenditures (PCE) Price Index and jobs data land later this week. These are the week's headline risk events. A softer-than-expected PCE print would pull the dollar lower and lift the gold price; a hot number would reinforce hike bets and pressure $4,110.
Devil's Advocate
The bearish case has one clear flaw: positioning is already stretched. With H4 RSI at 28.4 and D1 RSI at 36.3, a short squeeze is entirely plausible if yields pause their climb.
The level that invalidates the bearish bias is $4,148.95, the EMA20. A sustained hourly close above it, followed by a push through $4,172, would signal buyers are stepping back in.
Conversely, if $4,110.87 breaks on volume, the bearish case strengthens toward $4,000. Watch the reaction at the Bollinger lower band of $4,104.75 — that is the last line before a deeper flush.
Trading Strategy for Asian Session
With liquidity thin, patience beats aggression. Do not chase the first move of the session.
Short setup: Look for a rejection near $4,148.95 (EMA20) or $4,172 (1H pivot upside). Enter on a failed retest, stop above $4,175 — roughly one ATR beyond entry. First target $4,115, second $4,110.87.
Long setup: Only valid on a confirmed hold of $4,110.87 with a bullish reversal candle on the 1-hour. Enter above $4,115, stop below $4,100, target $4,148.95 then $4,172.
Risk no more than 1% of account equity per trade. Given ATR of $17.66, stops tighter than $12 will likely be noise-stopped. If you prefer to follow institutional flow rather than execute manually, professional gold trading signals can help frame entry and exit timing.
For traders who want physical exposure rather than leveraged positions, you can buy certified gold coins and bars directly, avoiding the volatility of intraday spot moves entirely.
Key Takeaways
- Gold price sits at $4,135.44, below all three key EMAs — bearish structure intact.
- Critical support at $4,110.87; a break opens the $4,000 psychological target.
- Resistance at $4,148.95 (EMA20) and $4,172 (1H pivot) caps upside.
- RSI at 39.4 is neutral, but H4 RSI 28.4 signals oversold — squeeze risk is real.
- ATR of $17.66 sets the expected hourly range; size stops accordingly.
- PCE and jobs data later this week are the next major catalysts for direction.
Conclusion
The gold price enters the Asian session on the back foot, pinned below its moving averages and vulnerable to a retest of $4,110.87. The macro mix — rising yields, elevated oil, hawkish Fed rhetoric — keeps sellers in control for now.
But oversold readings on the H4 and D1 charts argue against chasing weakness. The honest read is a market deciding whether this is a pause or a breakdown.
Trade the levels, not the narrative. A hold of $4,110 keeps the range intact; a break targets $4,000. A reclaim of $4,148.95 shifts the bias back to neutral. Either way, this week's PCE data will likely settle the argument.
Frequently Asked Questions
- What is the gold price right now?
- The gold price is $4,135.44 as of the 02:00 UTC hourly close, trading in the Asian session with a short-term bearish trend.
- Will gold price break below $4,110 support?
- It depends on whether sellers can force a close below $4,110.87. A confirmed break opens the $4,000 zone, while a hold keeps price rangebound between $4,110 and $4,172.
- What resistance must gold price clear to turn bullish?
- The first hurdle is the EMA20 at $4,148.95, followed by the 1-hour pivot target at $4,172. A sustained close above both would neutralise the bearish structure.
- How does the Fed affect the gold price this week?
- Markets price roughly a 70% chance of an October hike. A hot PCE print would reinforce that and pressure gold toward $4,110; a soft print would weaken the dollar and lift gold toward $4,172.
- What is the expected trading range for gold today?
- With ATR at $17.66, the expected hourly range is about 0.43% of price. Realistically, expect $4,110 to $4,172 unless a headline shifts the tone.
Trading Gold (XAU/USD) carries significant risk of loss and is not suitable for all investors. This content is for informational purposes only and does not constitute financial advice. Always conduct your own research and trade responsibly.