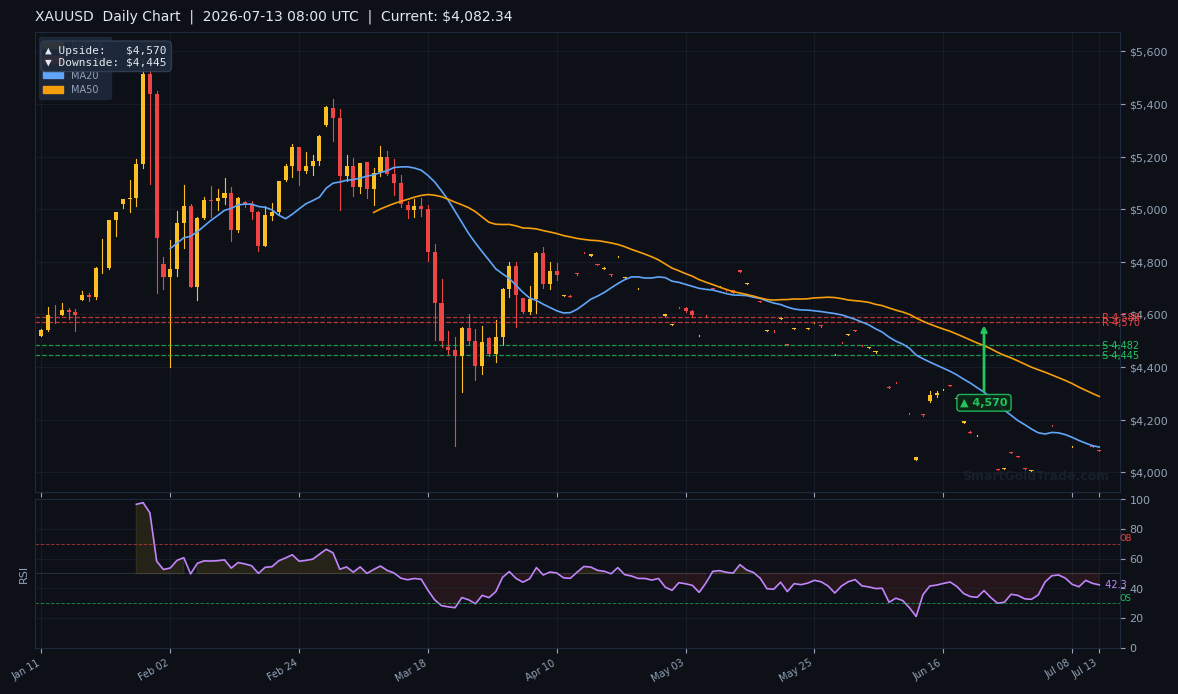
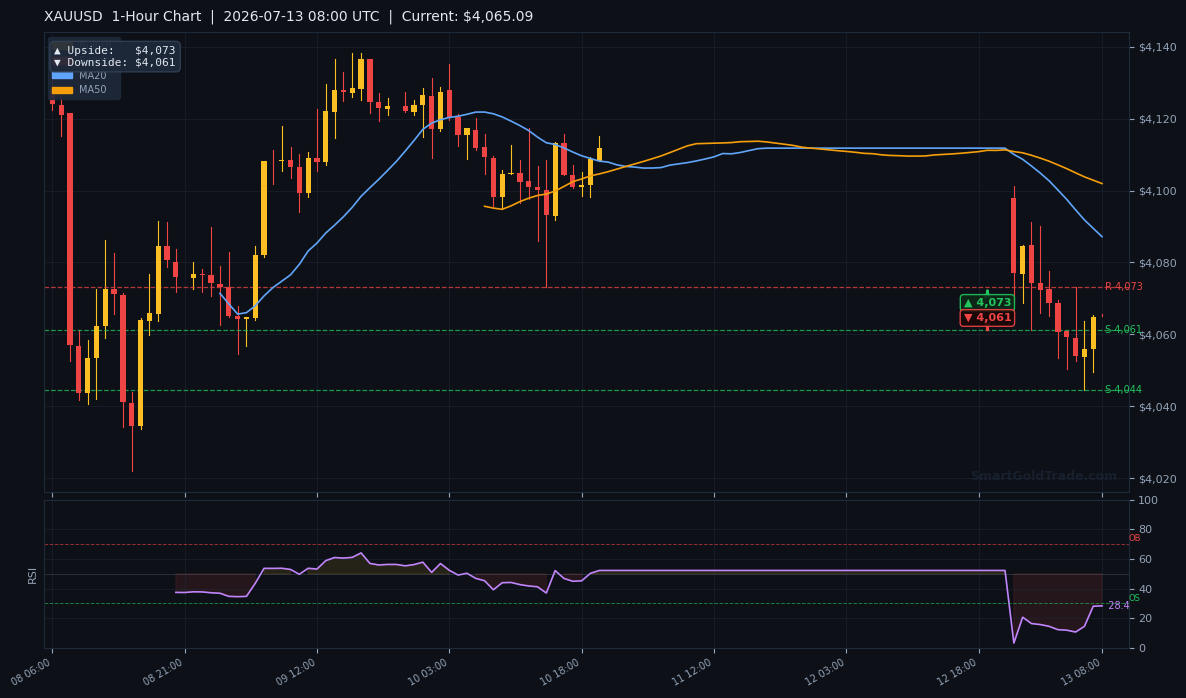
Gold price tumbled below $4,147 support during the European session, extending losses from last week’s Iran-driven spike. The yellow metal briefly surged to $4,184 on revived nuclear deal hopes before reversing sharply, reflecting fading safe-haven demand and a strengthening U.S. dollar. As London desks come online, XAU/USD dipped to test the $4,061 threshold but has since bounced to $4,074.09, the 1-hour chart’s downside pivot target. Longer-dated moving averages remain in bearish alignment, but the RSI is creeping toward oversold territory, hinting at a potential snap-back. With Tuesday’s U.S. CPI report and Fed Governor Warsh’s testimony looming, the macro backdrop could flip short-term direction quickly. The question now is whether the breakdown below $4,147 gains momentum or if bargain hunters stepping in at $4,061 have found the pivot, shifting short-term momentum.
Gold Price Market Overview
Macro Context
The U.S. Dollar Index holds near 104.5 while the 10-year Treasury yield edges around 4.20%, keeping pressure on non-yielding assets like gold. Last week’s hotter-than-expected producer price index (PPI) data reinforced the narrative that the Federal Reserve will maintain its restrictive stance, pushing rate-cut expectations further into the future. Geopolitically, the Iran nuclear deal headlines that earlier triggered a spike to $4,184 have temporarily faded, leaving gold without a fresh safe-haven bid. This combination of dollar strength, elevated yields, and diminished risk premium has dragged the gold price below key technical supports.
Session Outlook
The European session is shaping up to be a liquidity test, with London traders returning after the weekend and positioning ahead of Tuesday’s high-impact U.S. CPI release. Price action near $4,061 will be critical: a sustained break opens the door to $4,045 and possibly the $4,000 psychological handle. However, with the 14-period RSI at 38.6 — not yet oversold — there is room for one more leg lower before a mechanical bounce materialises. Expect intraday volatility to remain elevated, with an ATR-based range of roughly $4,046 to $4,072. The session’s tone will be set by whether bulls can defend $4,061 or whether the selling continues unabated.
Technical Analysis
Moving Average Structure
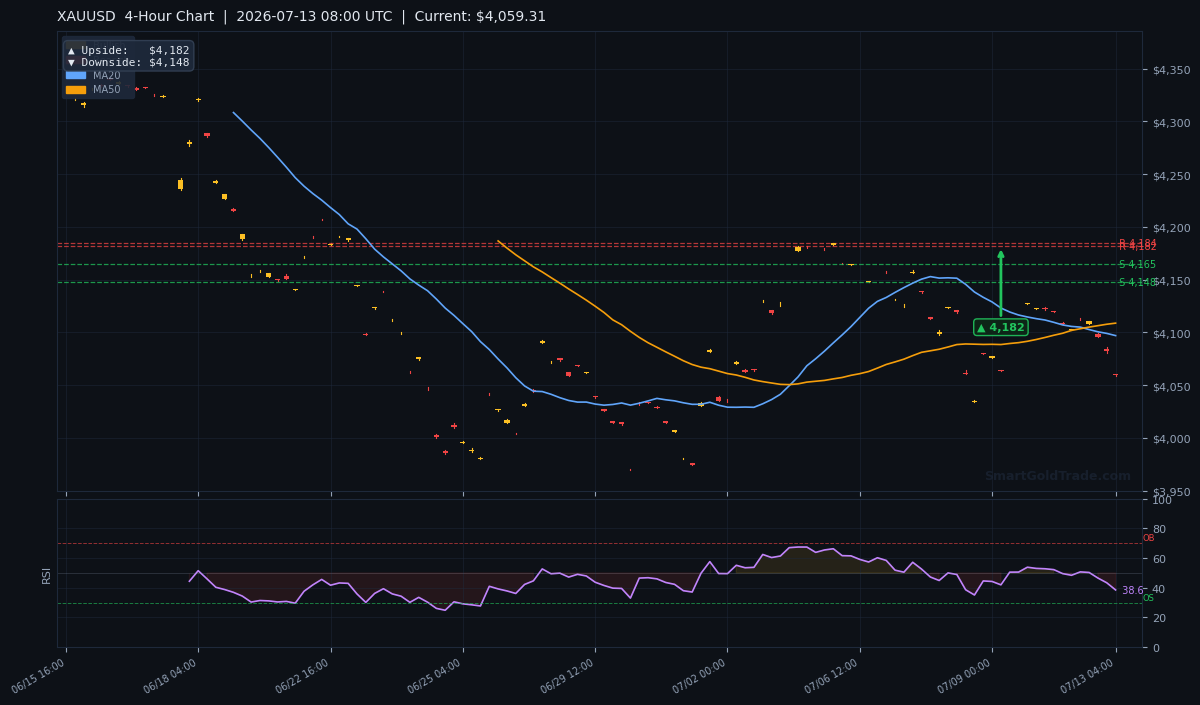
The moving average stack is unequivocally bearish. The short-term MA20 sits at $4,097.00, the medium-term MA50 at $4,108.79, and the long-term MA200 at $4,224.41. With the current gold price at $4,074.09 — still trading below all three — the trend remains firmly negative. The MA20 has crossed below the MA50, reinforcing short-term selling pressure. Until the gold price reclaims $4,097, any rally is a corrective bounce within a downtrend.
RSI and Momentum
The 14-period RSI reads 38.6, placing it in neutral territory but tilted towards the lower end. This is not yet a classic oversold signal, meaning the path of least resistance remains down. However, the RSI is approaching the 30 level that historically coincides with short-term reversals. A dip to 35 or below could attract contrarian buyers, especially if a bullish divergence forms on lower timeframes. Momentum oscillators on the 1-hour chart are beginning to flatten, hinting that the initial breakdown energy may be exhausting.
Key Price Levels
The pivot-based supports are S1 at $4,164.51 and S2 at $4,147.61 — both have now been broken and have turned into resistance. The immediate resistance cluster stands at R1 $4,184.32 and R2 $4,181.55, although the ordering is tight and reflects overlapping supply. For this session, the critical floor sits at $4,061, the 1-hour downside target. The average true range (ATR) of $12.71 suggests that the day’s swing will likely be contained between $4,046 and $4,072.
Price Targets from Pivot Arrows
| Timeframe | Upside Target | Downside Target |
|---|---|---|
| Daily | $4,570 | $4,445 |
| 4-Hour | $4,182 | $4,148 |
| 1-Hour | $4,073 | $4,061 |
Fundamental Drivers
The macro landscape is dominated by the imminent U.S. CPI report (Tuesday, July 14) and Federal Reserve Governor Warsh’s testimony this week. Last week’s PPI surprise reminded markets that inflation remains sticky, dashing hopes for a near-term rate cut. A strong CPI print on Tuesday would further entrench the higher-for-longer narrative, likely sending gold price below $4,045. Conversely, a softer reading could reignite rate-cut speculation and spark the contrarian bounce many traders are anticipating. On the geopolitical front, the Iran nuclear deal news that briefly lifted gold to $4,184 has been fully priced out, leaving gold vulnerable without a fresh crisis catalyst.
Key Event to Watch
The single most important event this week is the U.S. Consumer Price Index (CPI) release on Tuesday, July 14. A figure above consensus would validate the bearish trend and could accelerate the sell-off toward the daily downside target of $4,445 over the coming sessions. A downside miss, however, could trigger a sharp short-covering rally that rapidly reclaims $4,147 and targets the 4-hour upside level at $4,182. Traders must position for both scenarios.
Devil's Advocate
The bearish thesis hinges on technical momentum and dollar strength, but it has weak spots. A daily close above the broken S1 level of $4,164.51 would force a rethink, signaling a false breakdown and shifting the balance back to bulls. If the gold price subsequently clears $4,184.32, the downtrend would be invalidated, opening a path toward the daily pivot target at $4,570. Additionally, a dovish twist from Fed Governor Warsh — hinting at data-dependence that favours cuts — could torpedo the dollar and fuel a rapid gold recovery. The key reversal level to watch is $4,164.51; a settlement above it turns all short positions defensive.
Trading Strategy for European Session
The contrarian setup hinges on a bounce from the $4,061 pivot. Aggressive traders may consider a long entry near $4,061 with a stop loss placed at $4,045, just below the recent swing low and outside the ATR noise. This gives a risk of approximately $16.
The first take-profit target sits at the 1-hour upside marker $4,073 (reward ~$12), while a second target at the MA20 level of $4,097 offers a full risk-reward ratio of 1:2 or better. This interest-free spot gold trading strategy relies on precision — if the price breaks below $4,045, the bounce thesis is invalidated and the trade should be scratched immediately. Those who prefer confirmation may wait for a bullish hourly close above $4,072 before committing, using professional gold trading signals to fine-tune entry timing.
For the bearish camp, a sell-on-rally approach near $4,147 (now resistance) with a stop above $4,165 and targets at $4,061 and $4,045 remains valid, but the risk-reward is skewed given how extended the move already is. In either case, position sizes should reflect the elevated ATR of $12.71 and the pending CPI event risk.
Key Takeaways
- Gold price broke below $4,147 support and now tests the $4,061 downside pivot.
- All major moving averages — MA20, MA50, MA200 — are sloping lower, confirming a bearish structure.
- RSI at 38.6 indicates no oversold condition yet, but it is approaching bounce territory.
- A sustained move above $4,165 would invalidate the immediate bearish outlook.
- Tuesday’s U.S. CPI release is the make-or-break catalyst; a miss could ignite a rapid recovery toward $4,182.
- ATR of $12.71 suggests intraday swings between $4,046 and $4,072.
Conclusion
The gold price is at a critical inflection point after breaching $4,147. The technical picture is undeniably bearish, but the proximity to $4,061 and the oversold-adjacent RSI open the door for a contrarian bounce. Upcoming U.S. CPI data and Fed rhetoric will dictate whether the metal extends its decline toward $4,045 or stages a recovery back above $4,164. Traders must remain nimble, using $4,061 as the pivot and respecting stops below $4,045. With volatility set to rise, this is a session for precision, not conviction.
While the trading setups above focus on intraday volatility, many investors take a broader view. If you’re looking to hold gold beyond short-term swings, you can purchase physical gold coins and bars as a hedge against market turbulence.
Frequently Asked Questions
- Why did the gold price break below $4,147 support?
- The break was driven by a combination of a stronger U.S. dollar, rising Treasury yields after last week’s hot PPI data, and fading safe-haven demand following the Iran nuclear deal spike. The breach of $4,147 confirmed the bearish momentum.
- Is $4,061 a strong support level for gold?
- $4,061 is the 1-hour chart’s downside pivot target and has acted as a floor in earlier Asian trade. While not a major structural support, it is a tactical level that could attract a short-term bounce if sellers exhaust themselves.
- What will move the gold price this week?
- The U.S. CPI release on Tuesday, July 14, and Fed Governor Warsh’s testimony are the primary catalysts. A hot CPI could push gold below $4,045; a soft print could fuel a rally back to $4,182.
- Should I buy gold at $4,061?
- A contrarian long at $4,061 with a stop below $4,045 offers a 1:2 risk-reward if targeting $4,097, but only if the setup aligns with your risk tolerance. Waiting for a confirmed bounce above $4,072 reduces fake-out risk.
Risk Disclaimer: Trading Gold (XAU/USD) carries significant risk of loss and is not suitable for all investors. This content is for informational purposes only and does not constitute financial advice. Always conduct your own research and trade responsibly.