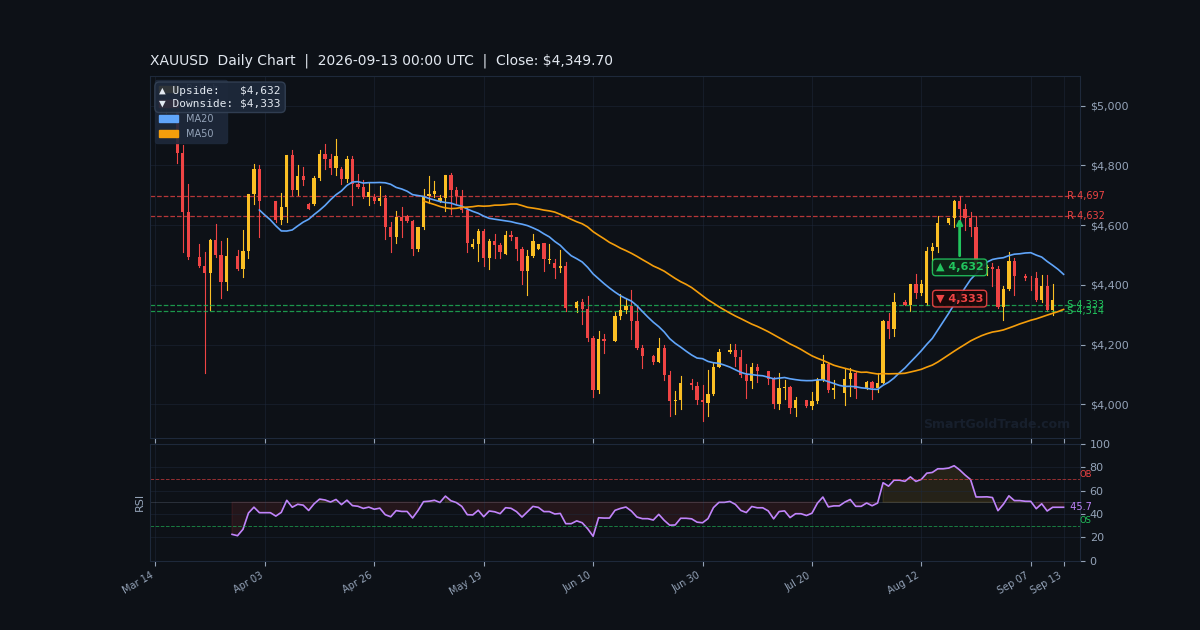
Gold (XAU/USD) trades at $4,349.70 per troy ounce as of the September 13, 2026 H1 close, with the market coiling directly on top of the $4,344.20 S1 floor. Last week delivered a two-sided mess: an early push toward the $4,500 handle collapsed into a sharp two-week slide that tested August breakout levels before stabilising.
This weekly gold price forecast next week covers September 13–19, 2026. It breaks down last week's price action, the macro events that moved the metal, the upcoming economic calendar, and the exact technical levels that define bullish, bearish and range scenarios.
The setup is unusually clean for a market this volatile. Price sits $5.50 below the H4 MA50, RSI is dead neutral at 47.7, and every meaningful pivot — $4,344.20, $4,360.80, $4,403.20 — is within a single day's average range.
Last Week in Review
Gold spent last week surrendering momentum, not direction. The metal failed to reclaim $4,500, then slid through the August breakout zone before finding buyers near yearly support.
Price Action Recap
Monday opened with residual strength from the prior week's breakout, which had produced the best weekly gain since January. That bid evaporated midweek as the dollar firmed near key support and real yields ticked higher.
The decline accelerated into Thursday, with XAU/USD slicing below the $4,400 handle and probing the low-$4,300s. Friday brought stabilisation rather than reversal — a lower high, a higher low, and a close at $4,349.70, essentially flat on the session.
The weekly candle structure is a bearish continuation body with a modest lower wick. Sellers controlled the week, but the close above $4,344.20 means the S1 pivot survived its first test.
Key Events That Moved Gold
Last week's CPI release was the primary catalyst. Inflation data landed hot enough to put the Fed squarely in the crosshairs, and gold's reaction was textbook: an initial spike, then a fade as the market priced a more restrictive policy path.
Kevin Warsh's Jackson Hole speech added a second layer of pressure. The tone was read as hawkish on inflation persistence, and gold fell below $4,600 in the immediate aftermath before extending losses into this week's open.
The World Gold Council's central bank buying report was the one bullish counterweight. Official-sector demand remained strong, which explains why the selloff stalled at support instead of accelerating into a full trend reversal.
Weekly Close Analysis
The close at $4,349.70 sits $5.50 below the H4 MA50 at $4,351.91 and exactly on the MA20. That is a market with no momentum edge in either direction.
More importantly, price closed $5.50 above S1 at $4,344.20. Holding that level into a new week keeps the August breakout structure technically intact, even after a two-week plunge.
A close below $4,344.20 would have confirmed the failed breakout. It did not happen — and that is the single most constructive fact bulls carry into this week.
Next Week Economic Calendar & Gold Impact
The week ahead is Fed-dominated. The FOMC rate decision and dot plot are the headline risk, with inflation and growth data front-loading the volatility before Wednesday.
Every high-impact release below has a two-sided gold reaction mapped. Traders should size positions for the possibility that the initial spike reverses within the first 30 minutes.
| Day | Event | Forecast | Previous | Gold Impact |
|---|---|---|---|---|
| Mon Sep 14 | NY Fed Manufacturing Index | +6.5 | +4.1 | Beat = mild bearish; miss = mild bullish |
| Tue Sep 15 | US Retail Sales (MoM) | +0.3% | +0.5% | Beat = bearish gold; miss = bullish gold |
| Wed Sep 16 | US CPI (YoY) | 3.1% | 3.2% | Hot = hawkish, bearish; cool = dovish, bullish |
| Wed Sep 16 | FOMC Rate Decision & Dot Plot | Hold, hawkish dots | Hold, neutral dots | Hawkish = bearish; dovish = strongly bullish |
| Thu Sep 17 | US Initial Jobless Claims | 228K | 221K | Higher = dovish, bullish gold |
| Fri Sep 18 | Fed Speakers / Quad Witching | — | — | Elevated volatility both ways |
Wednesday is the fulcrum. A CPI beat combined with hawkish dots would push real yields higher and likely force a break of $4,344.20 toward $4,333.
A CPI miss or a dovish dot plot would flip the narrative instantly. Gold's first upside magnet in that case is $4,360.80, then $4,403.20.
Friday's quad witching adds a mechanical wildcard. Options-related flows can produce violent, non-fundamental moves that ignore the week's macro narrative entirely.
Technical Analysis
The technical picture is neutral-to-bearish on the short timeframe, with price pinned below the H4 MA50 and momentum sitting at dead centre. Nothing is overextended, which means the next catalyst decides direction.
Moving Average Structure
On the H1 feed, MA20 sits at $4,349.70 — exactly at price — while MA50 sits at $4,351.91. That puts MA20 below MA50, a bearish short-term alignment.
The gap between the two averages is only $2.21, or roughly 0.05%. This is compression, not distribution. Such tight MA clusters typically resolve with an expansion move once a catalyst lands.
Price closing above $4,351.91 would flip the alignment bullish and open the path to the $4,360.80 R1 pivot. Failure to reclaim it keeps the bias tilted lower.
RSI and Momentum
RSI(14) reads 47.7, which is squarely in the neutral range. There is no overbought or oversold signal to trade against.
An RSI between 45 and 55 after a two-week decline suggests selling pressure has exhausted without buyers taking control. It is a pause, not a reversal.
Watch for an RSI push above 55 to confirm bullish follow-through, or a drop below 40 to validate a fresh leg lower toward $4,333.
Key Support and Resistance Levels
Every level that matters this week sits inside a $105 band. Here is the exact map from the SmartGoldTrade price feed and pivot analysis.
- S2: $4,298.30 — major weekly floor, invalidation of the bullish structure
- S1: $4,344.20 — immediate support, H4 downside target, must-hold for bulls
- Current Price: $4,349.70
- H4 MA50: $4,351.91 — first resistance, bias flips above here
- R1: $4,360.80 — near-term ceiling, breakout trigger
- R2: $4,403.20 — 1H upside target, key swing resistance
- Daily Upside Target: $4,632 — full trend extension objective
- Daily Downside Target: $4,333 — breakdown objective
- 4H Upside Target: $4,435 — intermediate bullish objective
- 1H Upside Target: $4,403 — session-scale target
Based on current volatility, the projected weekly range spans roughly $4,298 to $4,435. That brackets both the S2 floor and the H4 upside target, which is a realistic envelope for a Fed week.
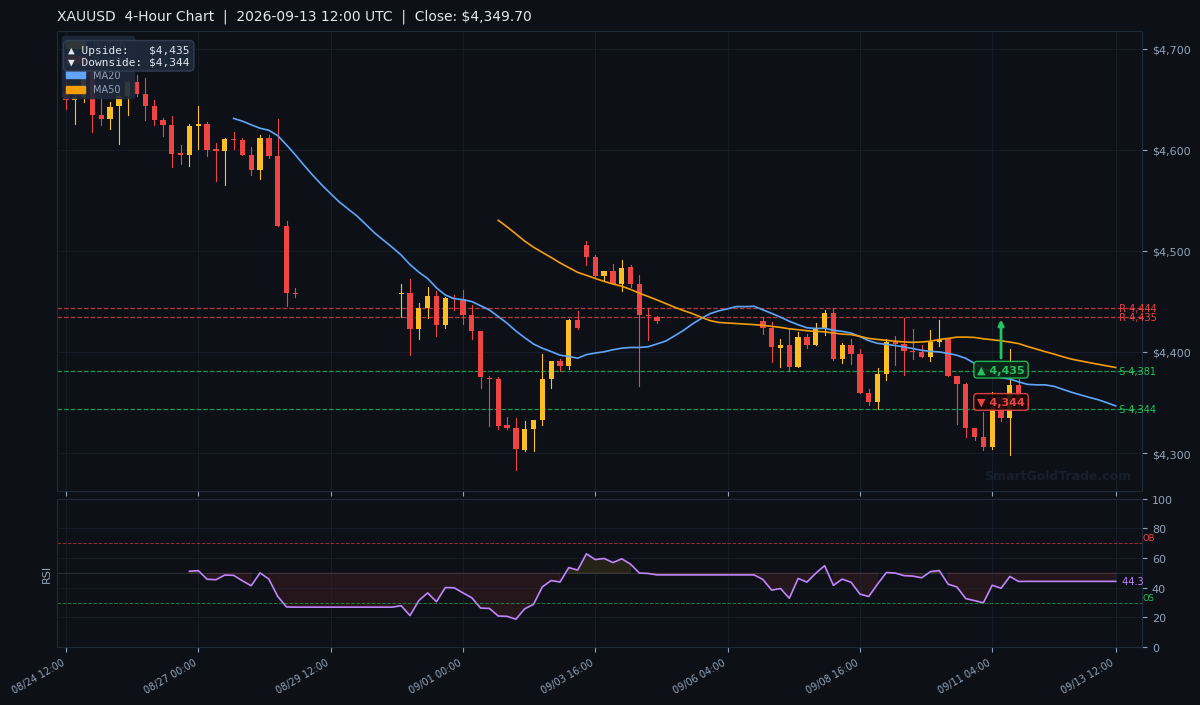
The H4 chart shows the descending structure from the $4,500 failure, with price now compressing against the $4,344 pivot. The drawn arrows mark $4,435 upside and $4,344 downside as the two live targets.
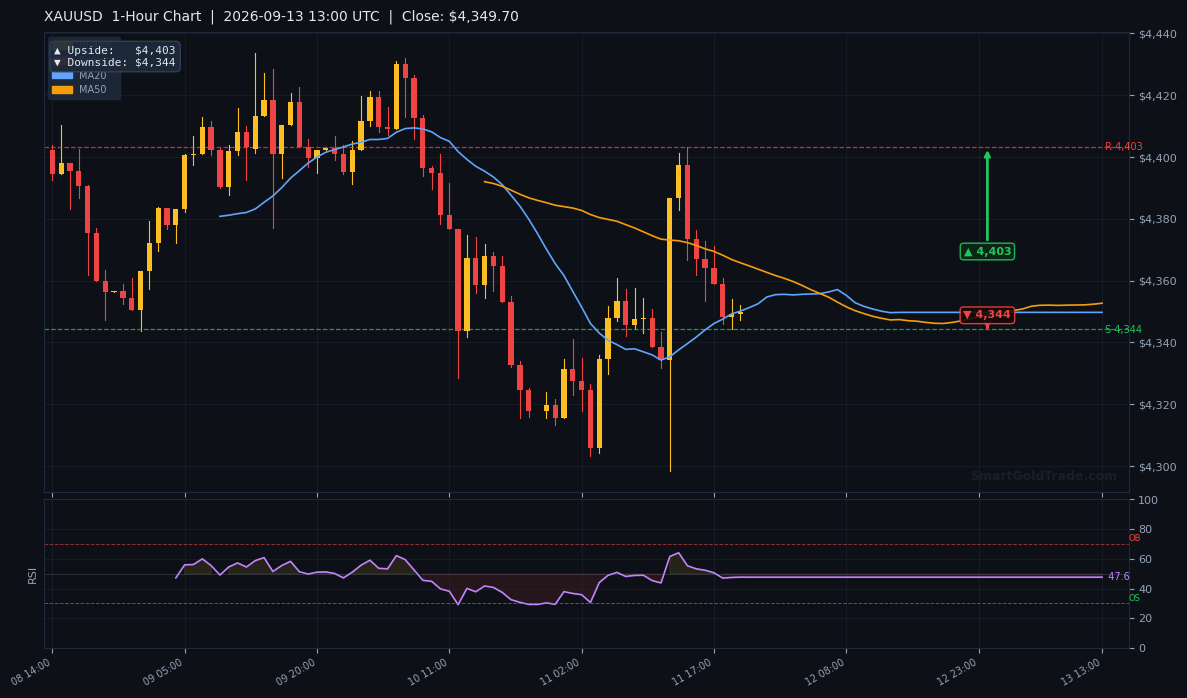
On the H1 chart, the MA20/MA50 cluster is visibly tight around $4,350, confirming compression. The 1H targets of $4,403 upside and $4,344 downside frame the intraday decision points.
Trading Scenarios This Week
Three scenarios cover the realistic outcomes. Probabilities reflect the neutral RSI, compressed MAs, and the binary nature of Wednesday's FOMC risk.
Bullish Scenario (probability 35%)
Trigger: a daily close above $4,360.80, ideally driven by a soft CPI print or dovish dot plot. That reclaims the H4 MA50 decisively and confirms buyers have absorbed the two-week supply.
- Entry zone: $4,352–$4,362 on a confirmed close above R1
- Target 1: $4,403.20 (1H upside target, R2)
- Target 2: $4,435 (4H upside target)
- Stop loss: $4,343 (below S1 and the weekly pivot)
- Risk-reward: approximately 1:2.5 to Target 1
Bearish Scenario (probability 45%)
Trigger: a daily close below $4,344.20, most likely on a hot CPI reading or hawkish dot plot. That confirms the failed August breakout and opens the daily downside objective.
- Entry zone: $4,344–$4,340 on a confirmed break and retest
- Target 1: $4,333 (daily downside target)
- Target 2: $4,298.30 (S2)
- Stop loss: $4,362 (above R1)
- Risk-reward: approximately 1:2.2 to Target 2
Neutral / Range-Bound Scenario
If the FOMC delivers no surprise and CPI lands near consensus, gold likely chops between $4,344.20 and $4,360.80 for most of the week. That is a $16.60 range — tight enough for mean-reversion scalps but hostile to breakout traders.
In this regime, buy the lower third of the range and sell the upper third, with tight stops just outside $4,340 and $4,365. For traders who prefer a rules-based approach without staring at charts all day, copy trading lets you mirror experienced gold traders automatically through the same halal framework.
How to Trade This Setup
Position sizing matters more than direction this week. With a binary FOMC event mid-week, risking more than 1% per idea exposes you to gap risk that stops cannot protect against.
Wait for daily closes, not intraday spikes. Wednesday's initial reaction to the dot plot is frequently the wrong one, and the reversal often comes within 30 to 60 minutes.
If you hold physical metal as a longer-term store of value, this week's noise is largely irrelevant. For those looking to buy certified gold coins and bars, dips toward $4,298–$4,333 have historically been accumulation zones rather than exit signals.
Keep an eye on real yields and the dollar index alongside the gold chart. When both move against gold simultaneously, the technical levels tend to break faster than the calendar suggests.
FAQ
What is the gold price forecast next week?
Gold enters the week at $4,349.70 with a neutral-to-bearish bias. The bearish case (45% probability) targets $4,333 and $4,298.30 if $4,344.20 breaks. The bullish case (35%) opens $4,403.20 and $4,435 above $4,360.80. A range-bound outcome is possible if the FOMC delivers no surprise.
What are the key levels to watch for XAU/USD this week?
Immediate support sits at $4,344.20 (S1), with $4,298.30 (S2) as the major weekly floor. On the upside, $4,360.80 (R1) is the first hurdle, followed by $4,403.20 (R2) and $4,435. A daily close above $4,351.91 would flip the short-term bias bullish.
How does the FOMC decision affect gold next week?
Wednesday's FOMC rate decision and dot plot are the week's dominant catalyst. Hawkish dots would push real yields higher and likely break $4,344.20 toward $4,333. A dovish surprise would send gold toward $4,360.80 and potentially $4,403.20. Traders should size positions for two-sided volatility around the release.
Risk disclaimer: This article is for informational purposes only and does not constitute investment advice. Gold trading involves substantial risk of loss and is not suitable for every investor. Past performance is not indicative of future results. Always conduct your own research and consult a licensed financial advisor before making any trading decisions.
Trading Gold (XAU/USD) carries significant risk of loss and is not suitable for all investors. This content is for informational purposes only and does not constitute financial advice. Always conduct your own research and trade responsibly.