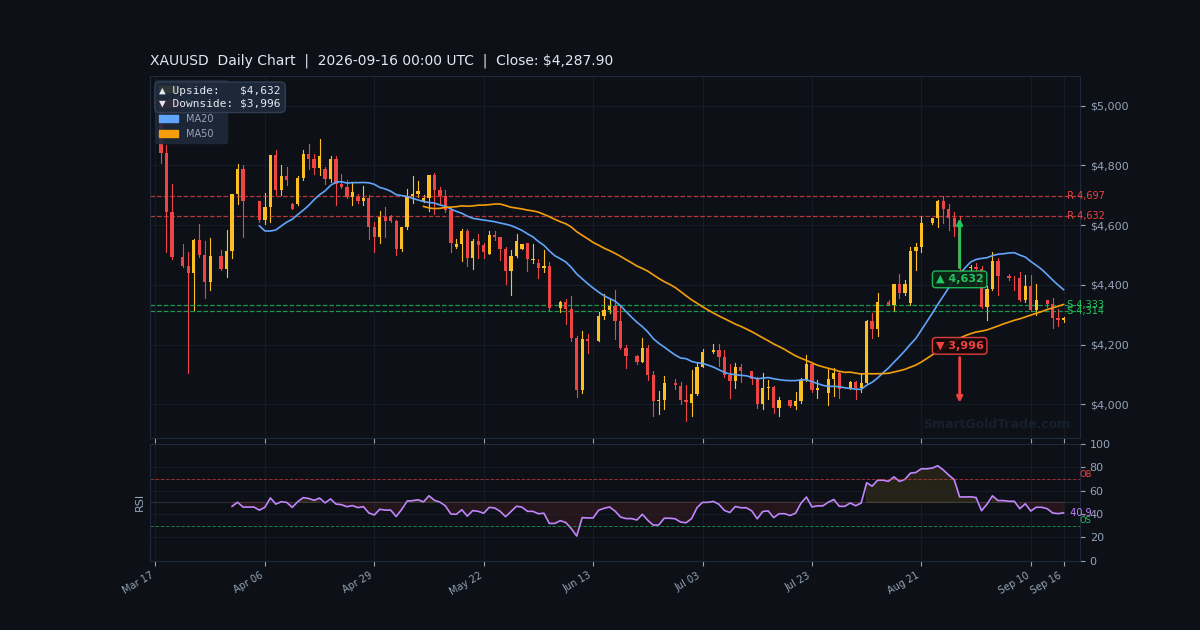
The gold price is holding near $4,282.75 during the Asian session on September 16, 2026, as traders adopt a cautious stance ahead of the Federal Reserve's highly anticipated interest rate decision later today. The metal remains pinned below the $4,300 psychological barrier, unable to muster a meaningful bounce despite a quiet start to the week. Yesterday's surge in crude oil prices, triggered by Saudi Arabia shutting a key pipeline, has reignited inflation fears and reinforced expectations for a hawkish Fed outcome. With the market pricing a 92.4% probability of a 25-basis-point hike, gold bulls are on the defensive. This session is about preparation, not prediction — the real move will come after the Fed speaks.
Gold Market Overview
Macro Context
The macroeconomic backdrop remains challenging for the gold price. The US Dollar Index (DXY) is hovering near a two-week high, buoyed by surging Treasury yields. The benchmark 10-year US Treasury yield briefly touched 5.041%, its highest level since 2007, before settling near 5.00%. Higher yields increase the opportunity cost of holding non-yielding assets like gold. Meanwhile, the market is overwhelmingly positioned for a 25-basis-point rate hike at today's FOMC meeting, with Fed Chair Kevin Warsh's press conference and the updated dot plot set to provide critical forward guidance. Geopolitical tensions in the Middle East, specifically the US-Iran conflict, continue to underpin safe-haven demand but are being overshadowed by the hawkish monetary policy narrative.
Session Outlook
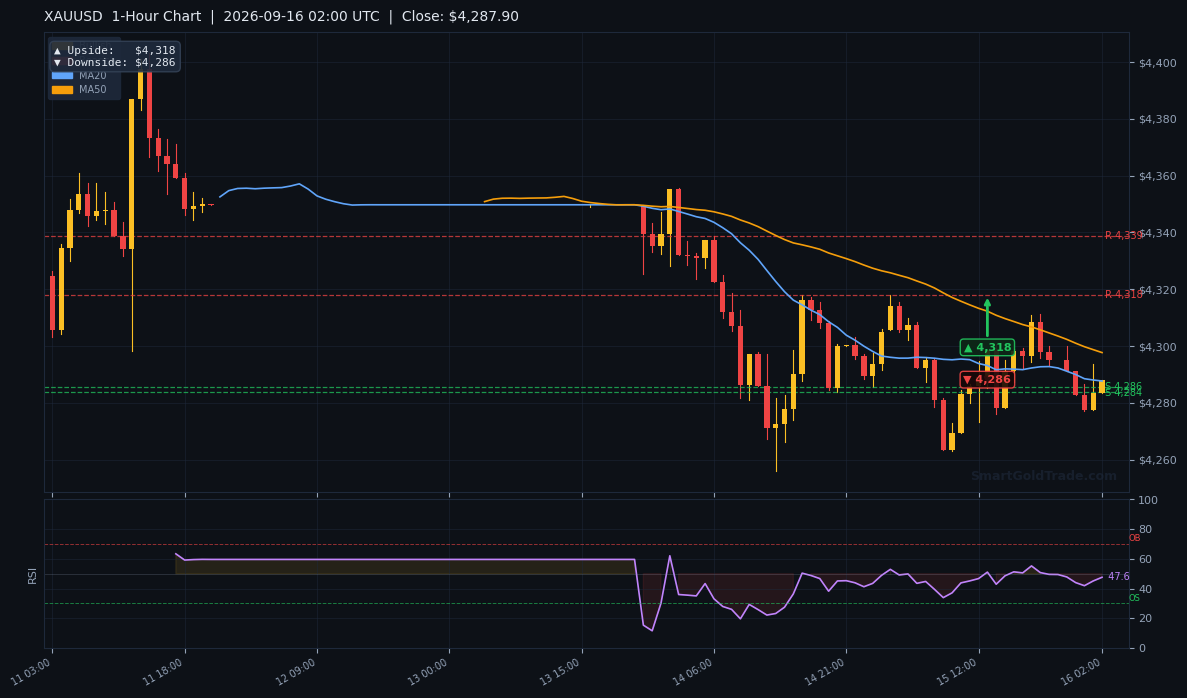
During the Asian session, liquidity is typically thin, and today is no exception. The gold price is likely to remain range-bound between $4,261 and $4,304 as traders await the Fed. The ATR(14) of $14.63 suggests an expected hourly range of approximately 0.34%, but with the FOMC looming, volatility could contract further. The key trigger for this session will be any pre-Fed positioning flows. If the RSI remains neutral near 45, expect consolidation. A break below $4,261 could accelerate selling pressure, while a push above $4,304 would require a significant catalyst. For now, patience is the order of the day.
Technical Analysis
Moving Average Structure
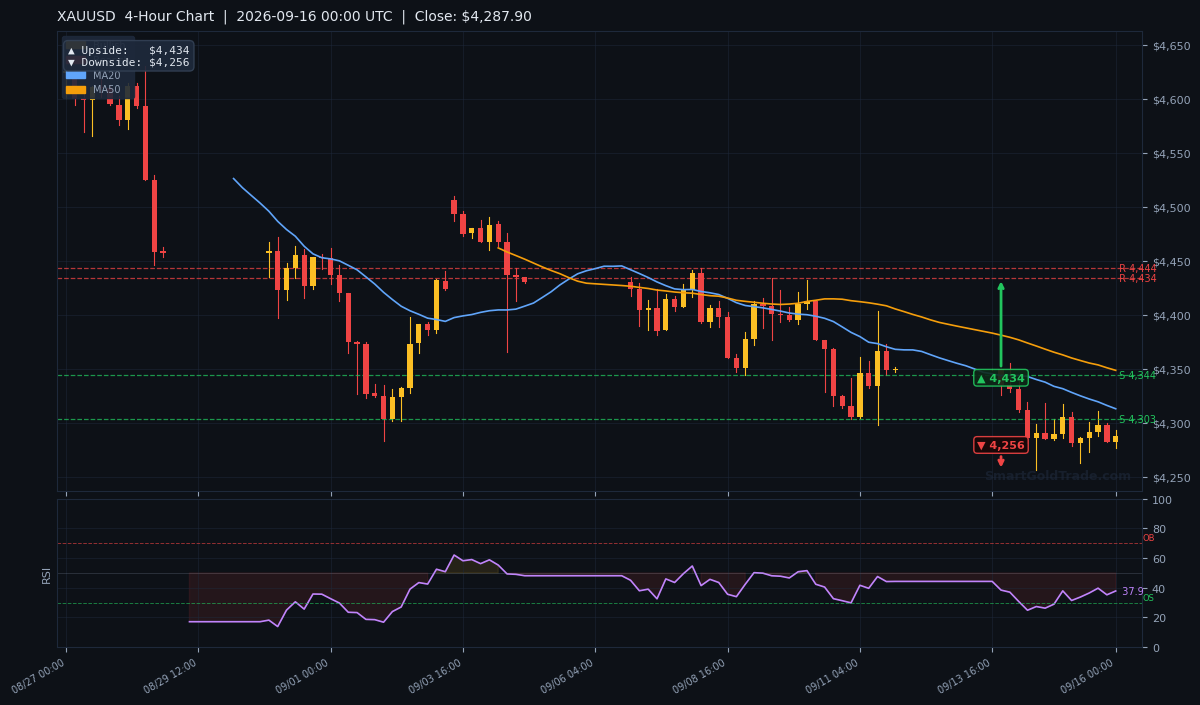
The gold price is trading well below its key moving averages, confirming a bearish structure. The EMA20 sits at $4,290.03, the EMA50 at $4,302.98, and the EMA200 at $4,362.82. The fact that price is below all three EMAs, and particularly below the EMA200, signals that the medium-term trend remains down. The H4 EMA200 at $4,364.72 and the D1 EMA200 at $4,319.44 further reinforce this bearish bias. For any bullish reversal to gain traction, the gold price must first reclaim the EMA20 at $4,290 and then challenge the EMA50 at $4,303.
RSI and Momentum
Momentum indicators are neutral but leaning bearish. The RSI(14) is at 45.4, which is in the neutral range but below the 50 midpoint, suggesting that sellers have a slight edge. The Stochastic oscillator shows readings of 31.7/42.7, indicating no clear overbought or oversold condition. The MACD is at -3.80 with a histogram of +0.01, meaning the negative momentum is flattening. This lack of strong directional momentum supports the case for continued range-bound trading until the Fed decision. Traders should watch for an RSI break below 40 or above 55 to signal the next directional move.
Key Price Levels
The immediate support for the gold price is S1 at $4,282.63, which is almost exactly where price is trading now. A break below this level would open the door to S2 at $4,261.38, which also coincides with the prior day's low (PDL). On the upside, R1 is at $4,284.89, a level that has been capping gains, while R2 at $4,304.31 is the more significant resistance. The Bollinger Bands are set at $4,307.70 (upper), $4,286.94 (middle), and $4,266.18 (lower), indicating a squeeze. The VWAP is at $4,284.42, slightly above current price, suggesting intraday selling pressure. Based on the ATR of $14.63, the expected range for this session is roughly $4,268 to $4,297.
Fundamental Drivers
The dominant fundamental driver for the gold price today is the Federal Reserve's interest rate decision, scheduled for later this session. The market is pricing in a 92.4% probability of a 25-basis-point hike, which would bring the benchmark rate to the 3.75%-4.00% range. This expectation has been fueled by a surge in crude oil prices after Saudi Arabia shut a key pipeline, raising inflation concerns. Higher energy prices feed into inflation, which could force the Fed to maintain a hawkish stance. As Daniel Pavilonis of StoneX noted, "Higher energy prices cause more inflation. More inflation could cause higher interest rates. That's not good for gold." The 10-year Treasury yield hovering near 5% further pressures the gold price by increasing the appeal of yield-bearing assets.
Key Event to Watch
The single most important event this week is the FOMC decision and Fed Chair Kevin Warsh's press conference. While a hike is largely priced in, the market will scrutinize the updated dot plot and Warsh's comments for clues on the future rate path. Given Warsh's aversion to forward guidance, there is a risk of a volatile reaction. If the Fed signals a pause or a less aggressive tightening cycle, the gold price could rally sharply. Conversely, a hawkish surprise could push the metal below $4,261 support.
Devil's Advocate
What could invalidate the bearish bias? The main risk is a "sell the rumor, buy the fact" scenario. If the Fed hikes as expected but signals that it is nearing the end of its tightening cycle, the US Dollar could weaken, and the gold price could rebound. A break above R2 at $4,304.31 would be the first sign of a bullish reversal. Additionally, if geopolitical tensions in the Middle East escalate further, safe-haven demand could override the bearish yield narrative. The key reversal level to watch is $4,304; a sustained move above this level would flip the short-term bias to bullish.
Trading Strategy for Asian Session
Given the thin liquidity and the looming Fed decision, the prudent strategy is to wait for clarity. For those looking to trade the range, consider a long position near S1 at $4,282.63 with a tight stop loss below S2 at $4,261.38, using the ATR of $14.63 to size the stop. The first take-profit target would be R1 at $4,284.89, followed by R2 at $4,304.31. Alternatively, a short position could be initiated on a break below $4,261 with a target of $4,240. However, given the event risk, it is advisable to reduce position sizes and avoid over-leveraging. For those interested in automated strategies that can navigate such event risk, exploring news event trading protection might be worthwhile. Also, for long-term investors, Shariah-compliant gold investment pools offer a way to gain exposure without the short-term volatility.
Key Takeaways
- Gold price trades at $4,282.75, below all key EMAs, confirming a bearish structure.
- Immediate support is at $4,261.38 (S2/PDL); resistance is at $4,304.31 (R2).
- RSI at 45.4 is neutral, but the MACD remains negative, though momentum is flattening.
- The Fed is expected to hike rates by 25 bps today; a hawkish outcome could push gold below $4,261.
- ATR of $14.63 suggests a session range of approximately $4,268 to $4,297.
- Key reversal level: a break above $4,304 would shift the bias to bullish.
Conclusion
The gold price is in a holding pattern at $4,282.75 as the market braces for the Fed's decision. The technical picture remains bearish, with price below all major moving averages and momentum indicators leaning negative. However, the neutral RSI and flattening MACD suggest that the bears are not in full control. The upcoming FOMC meeting is the pivotal event that will likely determine the next directional move. A hawkish Fed could see gold test $4,261 support, while a dovish surprise could trigger a rally towards $4,304. Traders should remain patient, manage risk carefully, and be prepared for volatility. The gold price is at a crossroads, and the Fed holds the key.
Frequently Asked Questions
- What is the current gold price?
- The gold price is currently $4,282.75 as of the Asian session on September 16, 2026.
- What are the key support and resistance levels for gold today?
- Immediate support is at $4,282.63 (S1) and $4,261.38 (S2). Resistance is at $4,284.89 (R1) and $4,304.31 (R2).
- How will the Fed decision affect the gold price?
- A 25-bps hike is 92.4% priced in. A hawkish surprise could push gold below $4,261, while a dovish tone could lift it above $4,304.
- Is now a good time to buy gold?
- With the Fed decision looming, it is a high-risk period. Long-term investors might consider Shariah-compliant gold investment pools for gradual accumulation. Short-term traders should wait for post-Fed clarity.
- What is the expected trading range for gold today?
- Based on the ATR of $14.63, the expected range is approximately $4,268 to $4,297.
Risk Disclaimer: Trading Gold (XAU/USD) carries significant risk of loss and is not suitable for all investors. This content is for informational purposes only and does not constitute financial advice. Always conduct your own research and trade responsibly.