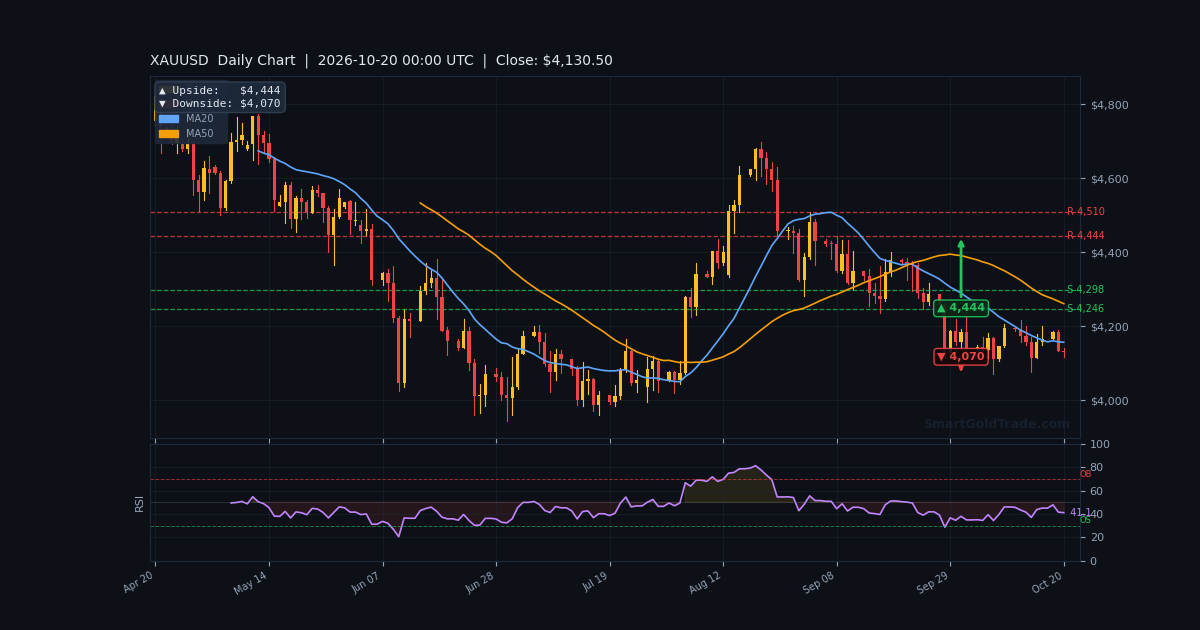
The gold price trades at $4,130.83 in the early Asian session, sitting just above the critical $4,130.25 support level after a bruising overnight decline. The metal fell through $4,150 as elevated US Treasury yields kept the dollar firm, extending losses from Monday's session. Last week's stronger-than-expected inflation prints continue to echo through the market, with Fed funds futures now pricing an 82.8% chance of a hold at the October 28 meeting. With liquidity thin and momentum stretched to the downside, the session ahead looks more about preparation than pursuit.
Gold Market Overview
Macro Context
The US Dollar Index hovers near 101.95, recovering from Friday's dip to 101.58. Benchmark 10-year Treasury yields climbed to 5.144%, while the 2-year sits at 4.778% — both acting as a persistent headwind for the non-yielding metal. Higher yields raise the opportunity cost of holding gold, and the market is clearly repricing the Fed's path after September's rate hike to 3.75%–4%.
Chairman Kevin Warsh's comments were read as supportive of a steady hand this month, though December hike expectations remain alive. A selloff in French bonds following weekend unrest added upward pressure on global yields, further weighing on bullion. Geopolitical risk remains a background factor, but for now, rates are driving the narrative.
Session Outlook
The Asian session opened with price pinned just above $4,130, and with ADX at 21.8 the market is ranging rather than trending. Expect a tight $4,118–$4,143 band unless Tokyo or Chinese flows pick up. Thin liquidity means moves can exaggerate — avoid chasing breakouts before European desks arrive.
Technical Analysis
Moving Average Structure
The EMA20 at $4,148.58, EMA50 at $4,156.80, and EMA200 at $4,161.32 are stacked above price, confirming a bearish structure. The gold price is trading below all three averages, and the H4 EMA200 at $4,228.38 reinforces the medium-term downtrend. Until price reclaims the EMA20, rallies are corrective.
RSI and Momentum
RSI(14) at 28.3 places the market firmly in oversold territory, raising the odds of a technical bounce. Stochastic at 10.3/5.3 confirms the stretched condition, while MACD at -9.99 with a -2.29 histogram shows bearish momentum still in play but decelerating. Oversold readings in a ranging market often precede mean-reversion toward VWAP at $4,129.47.
Key Price Levels
Immediate support rests at S1 $4,130.25 and S2 $4,125.28, with the session low near $4,118 as the deeper floor. Resistance sits at R1 $4,143.43 and R2 $4,152.27. The ATR(14) of $10.85 implies an expected hourly range of roughly 0.26%, so a session band of $4,120–$4,142 is realistic.
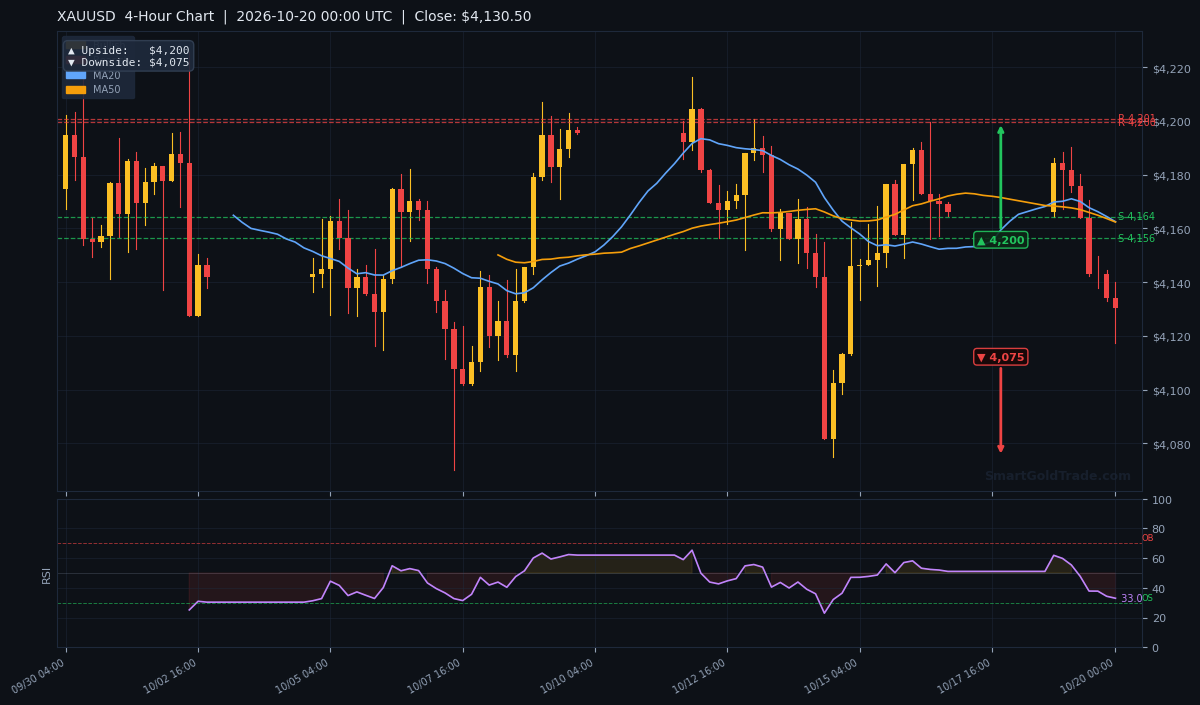
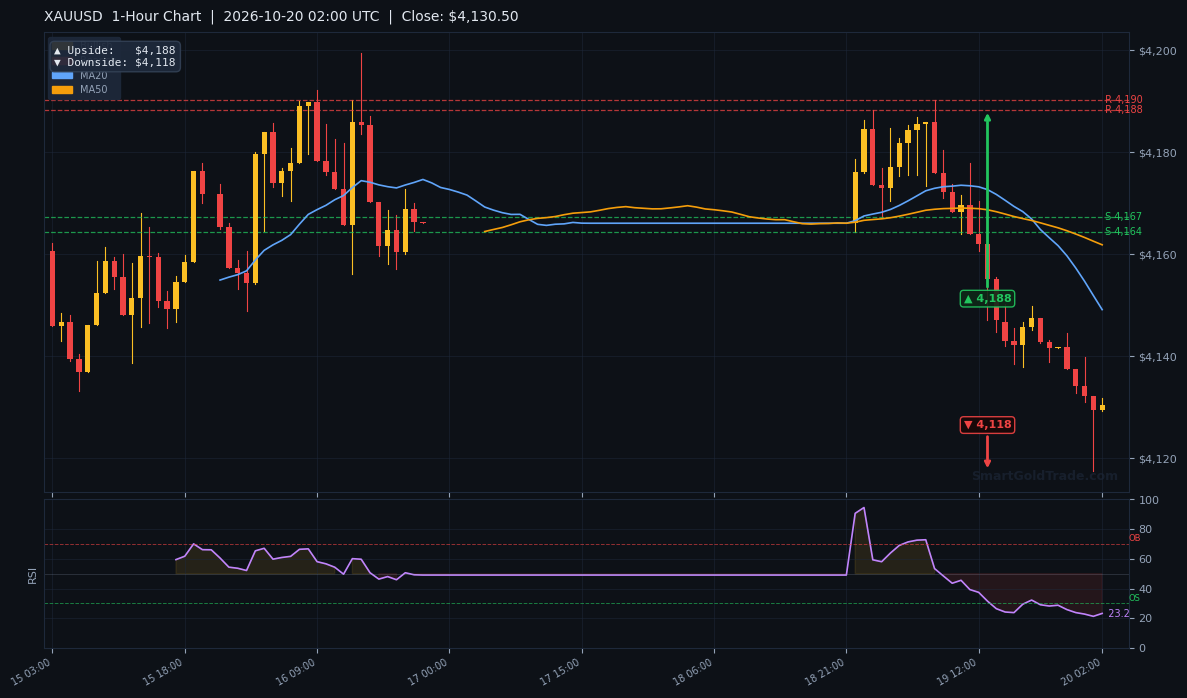
| Timeframe | Upside Target | Downside Target |
|---|---|---|
| Daily | $4,444 | $4,070 |
| 4-Hour | $4,200 | $4,075 |
| 1-Hour | $4,188 | $4,118 |
Fundamental Drivers
Last week's US inflation data came in hotter than expected, with headline CPI rising 0.6% month-on-month and 3.7% year-on-year. That reading, combined with a firm PPI print, has kept rate-hike expectations for December alive and supported Treasury yields. The 10-year yield at 5.144% remains the single biggest drag on the gold price.
Deutsche Bank strategists noted that a light data calendar this week leaves markets digesting those inflation numbers, while inflation swaps have moved higher on both sides of the Atlantic. The 1-year US inflation swap rose 17 basis points to 2.74%, a signal that price pressures are not yet tamed.
Key Event to Watch
The October 28 Fed meeting is the next major catalyst. Futures price an 82.8% hold, but any hawkish tilt from Warsh would extend the dollar's bid and pressure gold toward $4,118. Conversely, a dovish surprise could spark a squeeze toward $4,152.
Devil's Advocate
The oversold RSI argues for a bounce, but oversold can stay oversold in a strong downtrend. If price breaks and holds below S2 $4,125.28, the bear case targets the 1-hour downside pivot at $4,118 and potentially the daily downside at $4,070. A daily close below $4,125 would flip the short-term bias firmly bearish and invalidate the bounce thesis. Watch the VWAP at $4,129.47 — a sustained break beneath it favors sellers.
Trading Strategy for Asian Session
With liquidity thin, patience pays. For a long setup, look for a reclaim of $4,130.25 (S1) with a stop below $4,118 — roughly 1.2x the ATR of $10.85 — targeting R1 $4,143.43 and then R2 $4,152.27. That offers a favorable risk-reward near 1:1.5.
For a short setup, watch for rejection at R1 $4,143.43 with a stop above $4,152.27, targeting S1 $4,130.25 and S2 $4,125.28. Avoid entering in the middle of the range near VWAP at $4,129.47, where chop is most likely. Position size should be reduced given the weak ADX and thin session volume.
Key Takeaways
- Gold price at $4,130.83, below all major EMAs — bearish structure intact.
- RSI at 28.3 signals oversold conditions and bounce potential.
- Key support: S1 $4,130.25, S2 $4,125.28; resistance: R1 $4,143.43.
- ATR of $10.85 implies a $4,120–$4,142 session band.
- Fed hold odds at 82.8% for October 28 cap upside for now.
- 1-hour downside pivot at $4,118 is the line in the sand for bulls.
Conclusion
The gold price enters the Asian session at a decision point near $4,130, with oversold momentum arguing for a bounce but the broader structure still bearish. Thin liquidity means breakouts are unreliable until European desks arrive. The $4,125–$4,130 zone is the battlefield; a hold opens the door to $4,143, while a break targets $4,118. Traders who prefer a hands-off approach can follow top gold traders via copy trading while the market finds direction.
Frequently Asked Questions
- What is the gold price right now?
- The gold price is $4,130.83 in the Asian session, just above S1 support at $4,130.25.
- Is gold oversold?
- Yes, RSI(14) at 28.3 is below the 30 threshold, signaling oversold conditions and potential for a technical bounce toward $4,143.
- What are the key levels to watch today?
- Support sits at $4,130.25 and $4,125.28, with resistance at $4,143.43 and $4,152.27. The 1-hour downside pivot is $4,118.
- What could move gold this week?
- The October 28 Fed meeting dominates, with an 82.8% hold probability priced in. Any hawkish surprise could push gold toward $4,118.
- Should I buy gold at $4,130?
- Only with a defined stop below $4,118 and a target at $4,143. Thin Asian liquidity makes chasing risky.
Trading Gold (XAU/USD) carries significant risk of loss and is not suitable for all investors. This content is for informational purposes only and does not constitute financial advice. Always conduct your own research and trade responsibly.