The gold price is holding a fragile line at $4,281.10 as the European session opens, pinned between a stubborn bid near $4,283 and a wall of selling pressure from every major moving average. Monday's dip to a one-month low drew dip-buyers in Asia, but the bounce has stalled well short of the MA20 at $4,295.68.
That hesitation matters. The two-day FOMC meeting begins later today, and last week's hot PPI and sticky CPI prints have lifted bets for an imminent rate hike. Traders aren't chasing gold into that event — they're defending the $4,283 shelf and waiting.
This session sets the tone for Wednesday. If $4,283 gives way, the next stop is $4,253.64. Hold it, and a squeeze toward $4,304 becomes the first test of any recovery.
Gold Market Overview
Macro Context
The macro backdrop is actively hostile to gold. The US Dollar Index sits near 99.62, up 0.15% and close to a two-week high, while the 10-year Treasury yield has clipped 5% for the first time since 2023. Higher real yields raise the opportunity cost of holding a non-yielding metal.
Add Brent crude pushing toward $110 and the inflation story hardens. Energy-driven price pressure gives the Fed room to stay hawkish, which keeps the dollar bid and gold capped. The market is pricing near-certainty of a hike on Wednesday, so the real risk sits in the dot plot and Chair Kevin Warsh's tone.
Geopolitics is the counterweight. Monday's Houthi missile and drone attack on a Saudi air base at Khamis Mushait, plus Iran's refusal to return to talks, keeps a safe-haven floor under the metal. That's precisely why $4,283 is being defended rather than abandoned.
Session Outlook
European liquidity arrives with price below the VWAP at $4,300.44, which tilts intraday flow to the sell side. Expect a tighter range early as desks wait for the London fix and US pre-positioning ahead of the Fed.
The ATR of $11.96 suggests a normal hourly range near 0.28% of price. With ADX at 24.6, this is a ranging tape, not a trending one — meaning levels should be respected, and breakouts need volume to confirm. The trigger to watch is a clean hourly close below $4,283 or above $4,304.
Technical Analysis
Moving Average Structure
The trend structure is bearish. Price at $4,281.10 trades below the MA20 at $4,295.68, the MA50 at $4,320.41, and well below longer-term averages. That's a full stack of resistance overhead.
Until price reclaims $4,295.68 on a closing basis, rallies remain corrective rather than impulsive. The MA20 sitting below the MA50 confirms the bearish alignment.
RSI and Momentum
The RSI(14) reads 39.4 — neutral, with room to fall before oversold. It isn't signalling a reversal; it's signalling indecision. The Stochastic at 65.0/77.2 is the more interesting tell, sitting in overbought territory on the intraday frame despite the broader weakness.
That divergence suggests the Asian bounce is running out of fuel. MACD at -6.25 with a histogram of +2.46 shows bearish momentum that is decelerating — a pause, not a turn.
Key Price Levels
Support rests at S1 $4,282.63 and S2 $4,253.64. Resistance sits at R1 $4,338.80 and R2 $4,355.60. The Bollinger band structure at $4,319.83 / $4,294.63 / $4,269.42 frames the same story, with price hugging the mid-band.
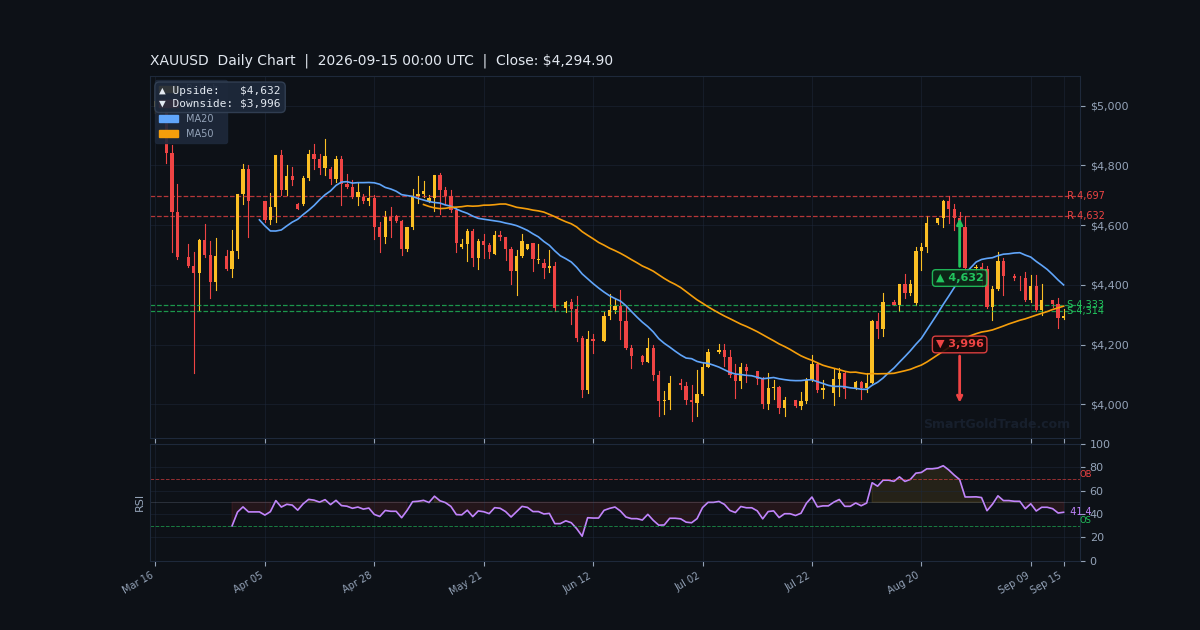
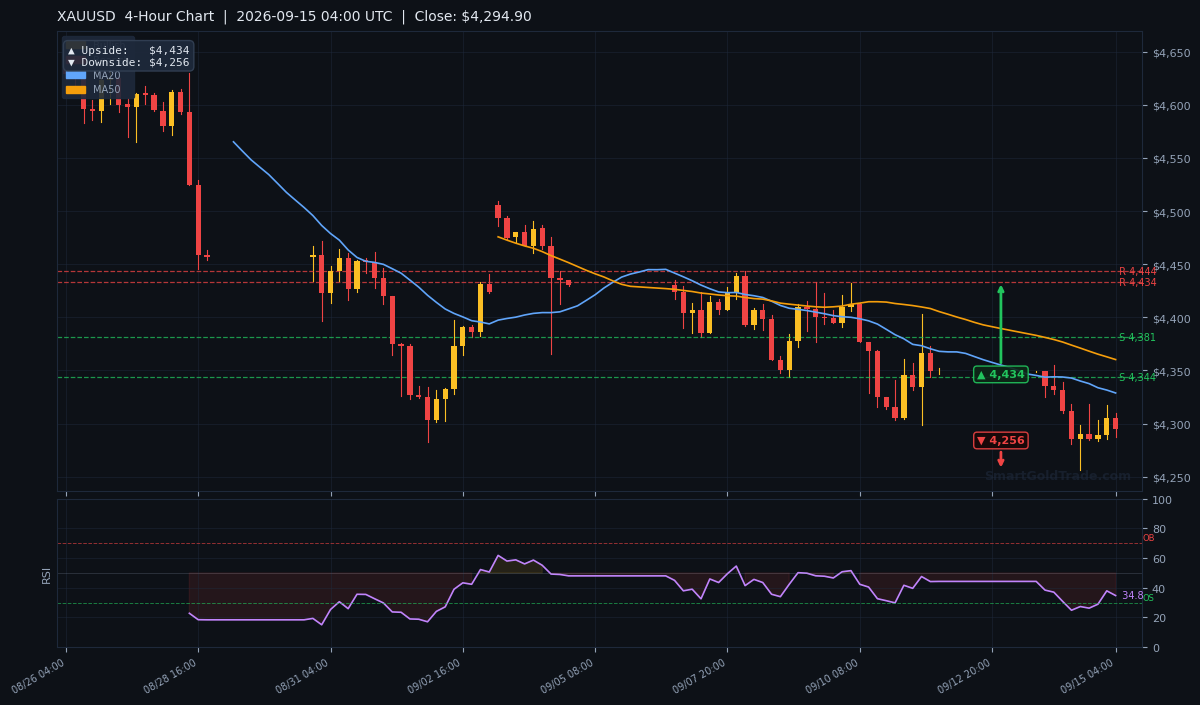
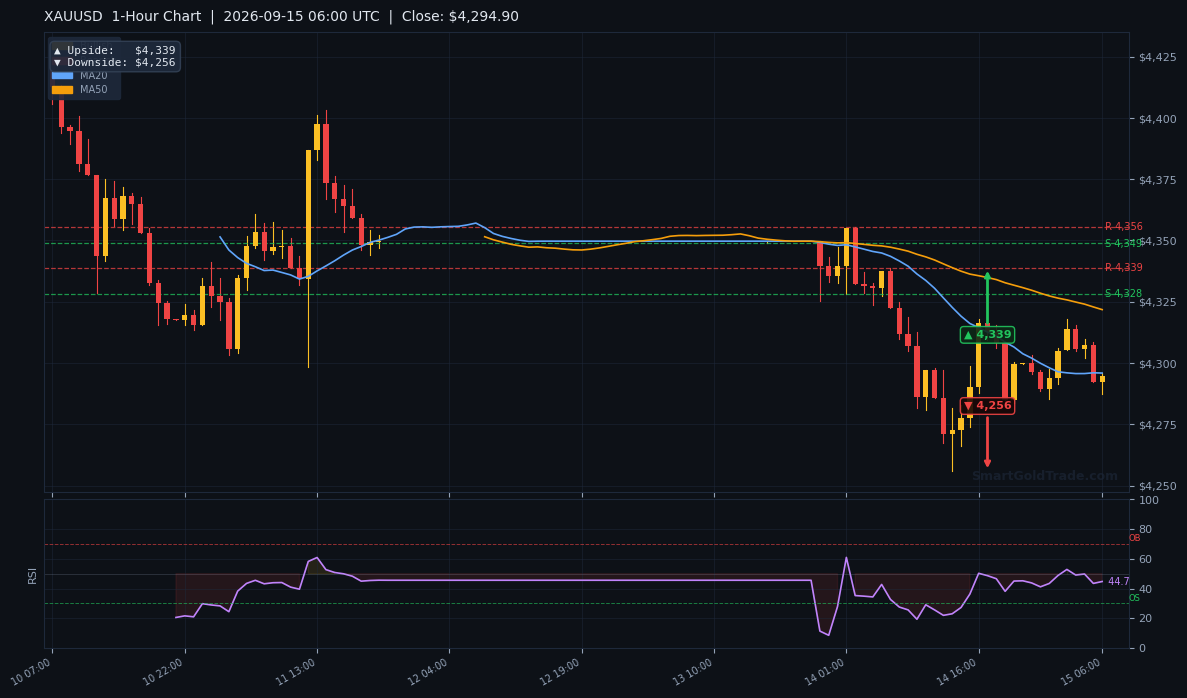
Using the ATR of $11.96, a typical session range from current price projects roughly $4,269 to $4,293 — a band that neatly contains both S1 and the mid-band. Chart targets point to $4,339 on the 1-hour and $4,434 on the 4-hour to the upside, with $4,256 as the shared downside objective.
| Timeframe | Upside Target | Downside Target |
|---|---|---|
| Daily | $4,632 | $3,996 |
| 4-Hour | $4,434 | $4,256 |
| 1-Hour | $4,339 | $4,256 |
Fundamental Drivers
The dominant driver is Wednesday's FOMC decision. Last week's Producer Price Index and Consumer Price Index reports both ran hotter than forecast, and the market has responded by pricing a near-certain hike. The 10-year yield breaking 5% confirms that repricing is real, not noise.
Dollar strength follows directly. The DXY near 99.62 keeps pressure on XAU/USD, and the Indian Rupee's slide to 95.85 against the dollar illustrates how broad this move is. Gold pays no yield, so when the risk-free rate rises, it competes from behind.
Offsetting that, Middle East risk remains live. Monday's attack on the Saudi air base and Iran's refusal to negotiate keep a bid under safe havens. Oil near $110 cuts both ways — it supports gold as an inflation hedge while simultaneously justifying the Fed's hawkish stance.
Key Event to Watch
Wednesday's FOMC statement, dot plot, and Chair Warsh's press conference are the week's defining events. A hike is largely priced, so the reaction hinges on the guidance. A hawkish dot plot pushes gold toward $4,253.64. A softer tone, or any hint of a pause, opens a run at $4,338.80 and beyond.
Devil's Advocate
The bearish case isn't bulletproof. Price is already below every major moving average, RSI at 39.4 isn't oversold, and the market has had days to price the hike. That combination often precedes a 'sell the rumour, buy the fact' reversal.
If gold reclaims $4,295.68 and holds above the VWAP at $4,300.44, the bearish structure weakens materially. A daily close above $4,320.41 would flip the bias outright and target the 1-hour objective at $4,339.
Watch the dollar as the tell. Any DXY rejection from the 99.60–100.00 zone would be the first signal that the hawkish trade is crowded.
Trading Strategy for European Session
The primary setup is a short from the $4,295–$4,300 zone, which aligns with the VWAP at $4,300.44 and the MA20 at $4,295.68. That confluence makes it the cleanest fade level on the board.
Place the stop above $4,320.41 (MA50), giving roughly $20–$25 of risk — slightly above the ATR of $11.96. First target is $4,283, second is $4,256, matching the 1-hour and 4-hour downside arrows. That delivers a risk-reward near 1:2 on the second objective.
For the long side, wait for a confirmed hourly close above $4,295.68. Entry there targets $4,320.41 first, then $4,338.80, with a stop below $4,281. Don't take this trade before the Fed — the risk of a headline-driven gap is too high.
Position sizing should be conservative. With ADX at 24.6 and a ranging tape, false breaks are common. If you'd rather follow pre-mapped institutional levels than build your own, professional gold trading signals cover entry, stop, and target in real time.
Not every trader wants to sit through a Fed week, though. Mirroring a proven desk with a copy trading setup lets you stay involved without second-guessing every tick. It's a sensible middle ground when the technicals are this two-sided.
Key Takeaways
- Gold trades at $4,281.10, below the MA20 ($4,295.68) and MA50 ($4,320.41) — a bearish stack.
- Critical support is $4,282.63 (S1); a break opens $4,253.64 (S2) and the $4,256 chart target.
- Immediate resistance is $4,338.80 (R1), backed by $4,355.60 (R2).
- RSI at 39.4 is neutral, while the Stochastic at 65.0/77.2 flags a fading intraday bounce.
- ATR of $11.96 projects a session range of roughly $4,269–$4,293.
- Wednesday's FOMC decision and dot plot are the week's dominant catalysts for both gold and the dollar.
Conclusion
The gold price enters the European session on the back foot. Price sits below every meaningful moving average, the dollar is firm near 99.62, and the 10-year yield above 5% is doing the heavy lifting for the bears. The $4,283 shelf is the line that matters today.
Hold it, and gold grinds sideways into the Fed, with $4,295 the ceiling. Lose it on a closing basis, and $4,253.64 comes into play quickly. Either way, this is a level-driven tape, not a trend one — patience over aggression.
The bias leans bearish while price stays under $4,295.68, but the FOMC outcome can override any technical read. Trade the levels, respect the ATR, and keep size small into Wednesday. For those looking to build a longer-term position in the metal itself, purchase physical gold as a tangible hedge alongside any tactical trades.
FAQ
- What is the gold price right now?
- Gold is trading at $4,281.10 during the European session, down 0.19% on the day from the daily open of $4,299.31.
- What are the key support levels for gold today?
- The first support is S1 at $4,282.63. A break below that opens S2 at $4,253.64, which also matches the 1-hour and 4-hour downside chart target of $4,256.
- How will the FOMC decision affect the gold price?
- A hike is largely priced. A hawkish dot plot could push gold toward $4,253.64, while a softer tone could lift it above $4,338.80 and toward $4,339.
Trading Gold (XAU/USD) carries significant risk of loss and is not suitable for all investors. This content is for informational purposes only and does not constitute financial advice. Always conduct your own research and trade responsibly.