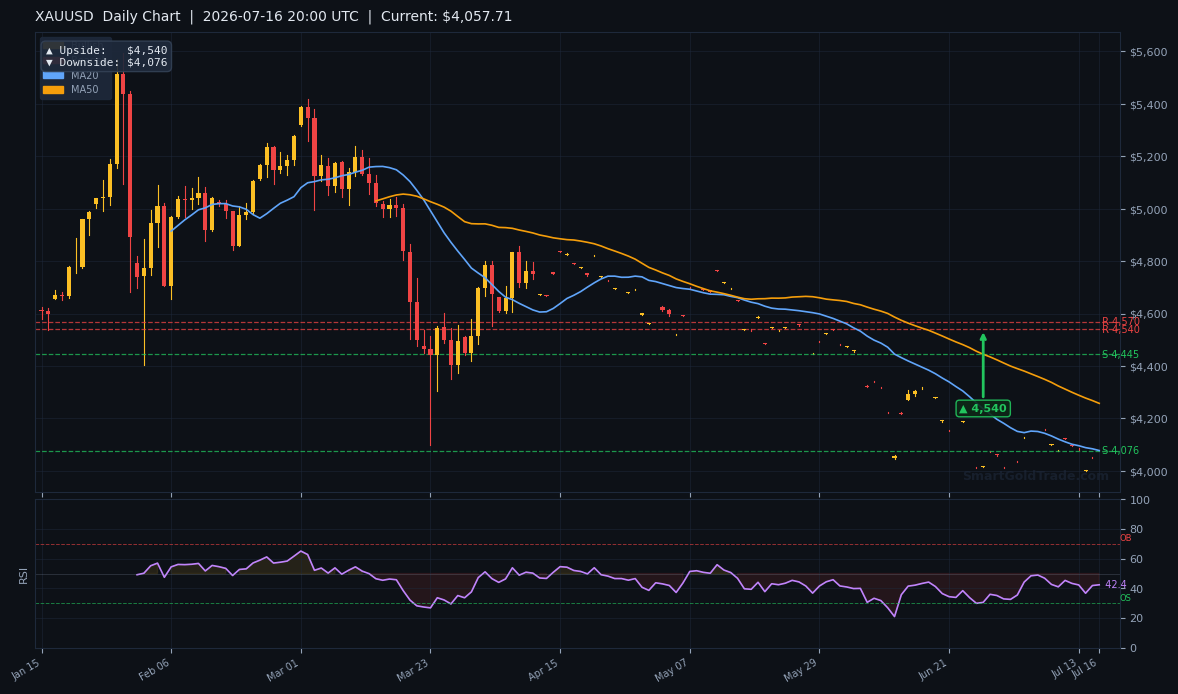
Gold price (XAU/USD) has broken below the psychological $4,000 support in American trading, sliding to $3,974.93 per troy ounce after an earlier PPI-led bounce completely evaporated. The US Dollar Index (DXY) initially dipped 0.5% to 100.40 on a soft June Producer Price Index report, but a steady intraday recovery in the greenback has forced the gold price back below the critical threshold. The breakdown turns the short-term outlook decidedly bearish and shifts attention toward deeper support zones.
Gold Price Market Overview
Macro Context
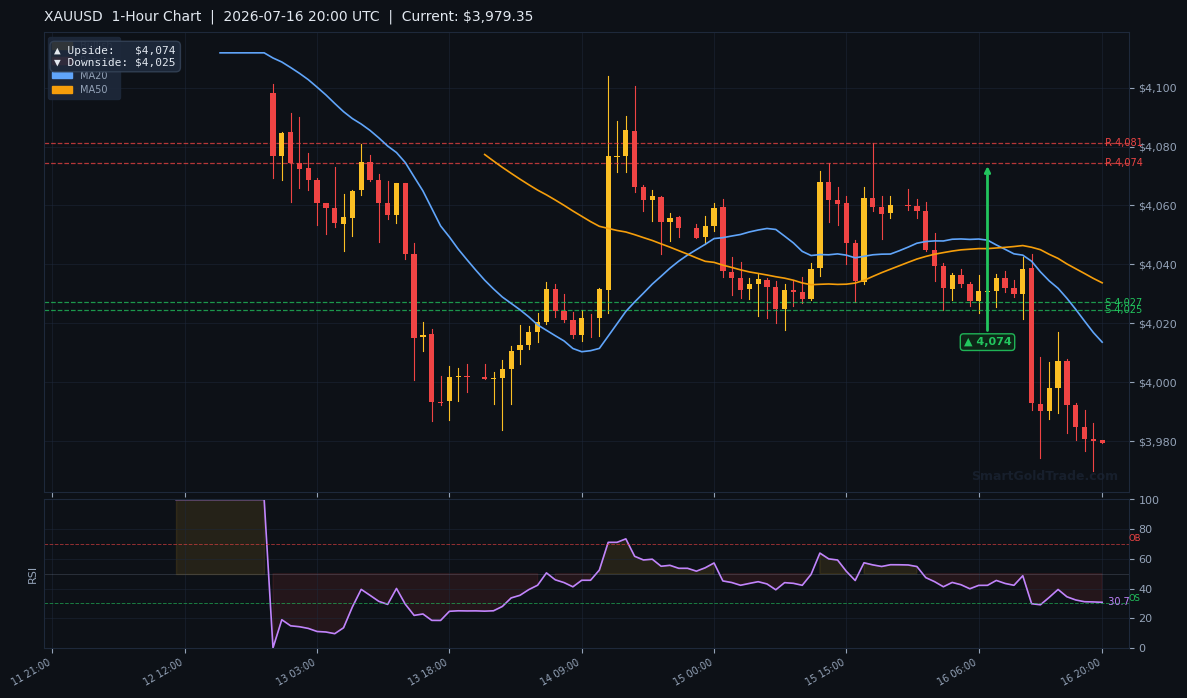
The DXY slipped after the June PPI print missed forecasts—headline wholesale inflation fell 0.3% month-over-month, while the annual rate cooled to 5.5%, well below the 6.2% consensus. The gold price spiked toward the $4,074 hourly target as real yields compressed, only to run out of steam when dollar bulls re-entered late in the session.
US Treasury yields have also softened, yet the broader trend of a resilient American economy is keeping haven demand for bullion capped. Geopolitical uncertainties in Europe and the Middle East still provide an underlying safety bid, but that bid is not strong enough to prevent a decisive gold price breakdown during the American afternoon.
Session Outlook
The American session typically injects deeper liquidity and widens trading ranges, and today that liquidity has been used to probe below $4,000. Based on a 14-period ATR of $14.64, the intraday volatility band spans roughly $3,960 to $3,989.
Sellers are firmly in control, and a sustained gold price below the round-number handle opens the door to a quick test of the $3,960 area. A reversal back above $4,000—and more importantly a close above it—would be required to signal that the breakdown was a false move.
Gold Price Technical Analysis
Moving Average Structure
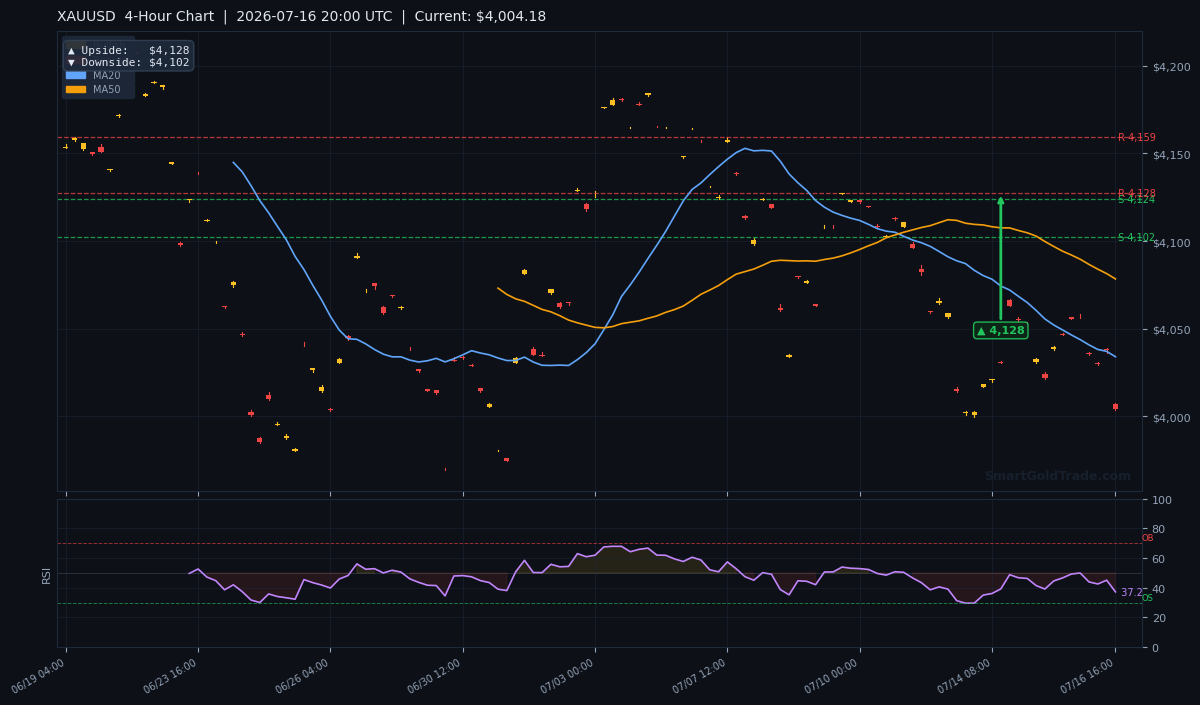
The moving averages paint a negative picture. The 20-period MA at $4,034.04 acts as immediate overhead resistance, while the 50-period MA at $4,078.43 adds a second layer of selling pressure. The 200-period MA sits far above at $4,176.96, confirming that the gold price is trading in bear territory across all three timeframes. The MA20 has already crossed below the MA50, a bearish alignment that will keep rallies very short-lived until the gold price can reclaim at least $4,034.
RSI and Momentum
The 14-period Relative Strength Index (RSI) has dropped to 32.1, edging deeper into bearish territory after the gold price sliced through $4,000. A reading this low often signals waning downside momentum and can precede an oversold bounce, but the break of a major psychological level makes it dangerous to fade the trend. If RSI stabilizes and crosses back above 35, a minor relief rally could push the gold price back toward the old support-turned-resistance at $4,000.
Key Price Levels
Chart-derived pivot points now reflect the bearish shift, with the gold price well below its short-term equilibrium levels. The table below shows updated daily, 4-hour, and 1-hour projections calculated from the post-breakdown price structure.
| Timeframe | Resistance (Bull Target) | Support (Bear Target) |
|---|---|---|
| Daily | $4,540 | $3,820 |
| 4-Hour | $4,128 | $3,920 |
| 1-Hour | $4,074 | $3,950 |
Immediate support comes in at the psychological $3,960 level (the round number just below today’s low), followed by the 1-hour bear target at $3,950. A sustained gold price below that would put $3,920 and eventually $3,820 on the radar. To reclaim any bullish momentum, bulls must push the price back above $4,000 and then the $4,034 moving average.
Fundamental Drivers
Yesterday’s soft PPI data remains the headline, but the gold price is now trading lower because the market is looking ahead. The disinflationary impulse initially lifted bullion, yet traders quickly shifted attention to the fact that the Fed is likely to stay on hold regardless—a steady rate environment that, paradoxically, can support the dollar when other economies are slowing. Real yields may have eased, but the lack of a near-term catalyst for further dollar weakness is giving sellers the upper hand.
Friday’s US Retail Sales report for June is the next big test. A weak retail print would revive the gold price by cementing the disinflation story, potentially forcing the DXY back below 100.40. A strong number, however, would signal resilient consumer spending, lift rate-hike fears, and likely drive the gold price toward $3,920 or lower.
Devil’s Advocate
The bearish outlook hinges on the gold price failing to reclaim $4,000. A sudden dovish shift from a Fed official or an unexpected geopolitical flare-up could push gold back above this line and trigger a vicious short squeeze. The risk is real: many algorithmic traders have placed their stops just above $4,000, so a move to $4,034 could happen fast. If the dollar index drops back below 100.40, the gold price could stage a sharp intraday reversal.
Gold Price & Physical Gold Opportunity
When the gold price dips like this, long-term investors often see a buying window for physical bullion. Holding tangible gold is a time-tested hedge against currency weakness, and during volatile sessions the metal’s store-of-value appeal only grows. SmartGoldTrade offers Shariah-compliant physical gold products, giving you the ability to purchase physical gold in the form of 22K coins, 24K bars, or gold jewelry—all directly backed and deliverable. Owning physical gold fits seamlessly into an ethical investment strategy, letting you lock in a lower gold price without the riba and leverage traps found in conventional markets.
Trading Strategy for American Session
A bearish play book now works best. An entry zone around $3,985—just below the broken $4,000 floor—offers a high-probability short setup. A stop above $4,005 respects the ATR-based daily swing and keeps risk manageable. The take-profit target is the 1-hour bear pivot at $3,950, with the potential to add to the position if the gold price slices through that level on the way to $3,920.
For precise timing, many traders rely on professional gold trading signals to identify real-time momentum shifts and entry points. If you prefer a Sharia-compliant approach, SmartGoldTrade’s halal gold trading platform provides interest-free spot trading with direct physical ownership—no swap fees, no hidden riba, just pure exposure to the gold price moves.
Key Takeaways
- The gold price has broken under $4,000 and is now at $3,974.93, turning intraday bias bearish.
- Soft June PPI data initially gave gold a lift, but a dollar rebound erased the gains.
- RSI(14) at 32.1 signals bearish momentum, though an oversold bounce is possible if $4,000 is retaken.
- Next support rests at $3,960 and the 1-hour bear target of $3,950.
- A close back above $4,000 would invalidate the breakdown and open a retest of $4,034.
Conclusion
The gold price has decisively fallen below the $4,000 mark late in the American session, shifting the near-term momentum into bearish terrain. A late-day dollar rebound erased all PPI-driven gains, and unless buyers can recapture the round-number handle, a slide toward $3,950 and eventually $3,920 is likely. Friday’s Retail Sales print will either amplify the selling or give gold a chance to recover—stay nimble and trade the levels.
FAQ
- What is the gold price today, July 16, 2026?
- The gold price is $3,974.93 per troy ounce during the American session, having broken below the $4,000 support.
- What is the next support for gold after breaking $4,000?
- The immediate support levels are $3,960 and the 1-hour chart bear target at $3,950. A break below would expose $3,920.
- How will Friday’s US Retail Sales data affect the gold price?
- A weak retail sales report would likely boost the gold price by pressuring the dollar, while a strong number could extend the sell-off toward $3,920 or lower.
Risk Disclaimer: Trading Gold (XAU/USD) carries significant risk of loss and is not suitable for all investors. This content is for informational purposes only and does not constitute financial advice. Always conduct your own research and trade responsibly.