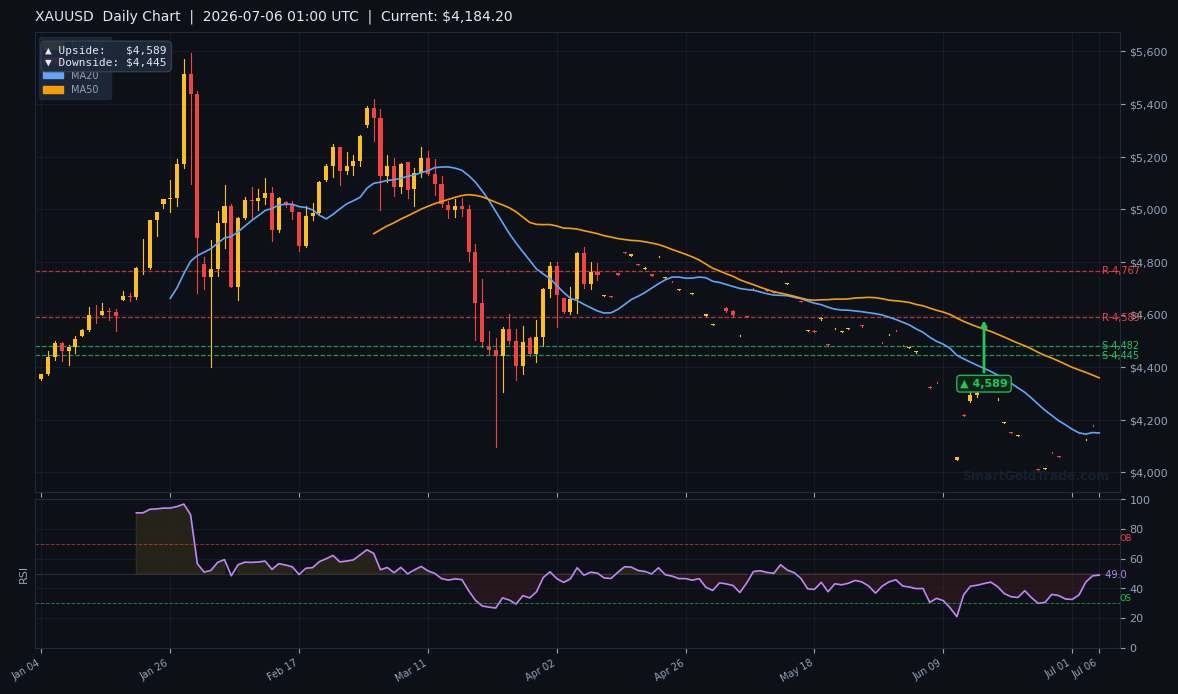
Gold price starts the Asian session hovering near $4,184, digesting last Friday’s softer‑than‑expected U.S. jobs report that sent XAU/USD sharply higher. The market now consolidates inside a thin liquidity pocket, waiting for a catalyst. With today’s ISM Services PMI release on the calendar, the calm could break quickly once U.S. traders return. Traders must resist the temptation to chase low‑volume moves; this is a session for preparation, not impulse.
Gold Market Overview
Macro Context
The U.S. Dollar Index remains subdued below the 104 handle after the Nonfarm Payrolls miss, while 10‑year Treasury yields hover near 4.30%. The Federal Reserve still leans against a near‑term rate cut, but soft data out of the services sector could strengthen the case for policy easing later in the year. Geopolitical noise from the Middle East adds a residual bid, keeping safe‑haven demand alive. Meanwhile, central bank gold buying remains robust, with several emerging‑market banks adding to reserves—a structural tailwind that supports gold price even when the dollar strengthens temporarily.
Session Outlook
Asian liquidity is always paper‑thin, and a Monday morning makes it even thinner. Expect gold to respect a narrow band ahead of the European open, likely between $4,165 and $4,200. Any spike on a minor headline should be treated with suspicion. The real move will align with the ISM publication. Until then, patience is the edge. Chasing a breakout in this environment is the fastest way to give back recent gains. Use this quiet window to map out entry and stop levels on the 4-hour chart, aligning them with Shariah principles of risk avoidance.
Gold Price Technical Analysis
Moving Average Structure
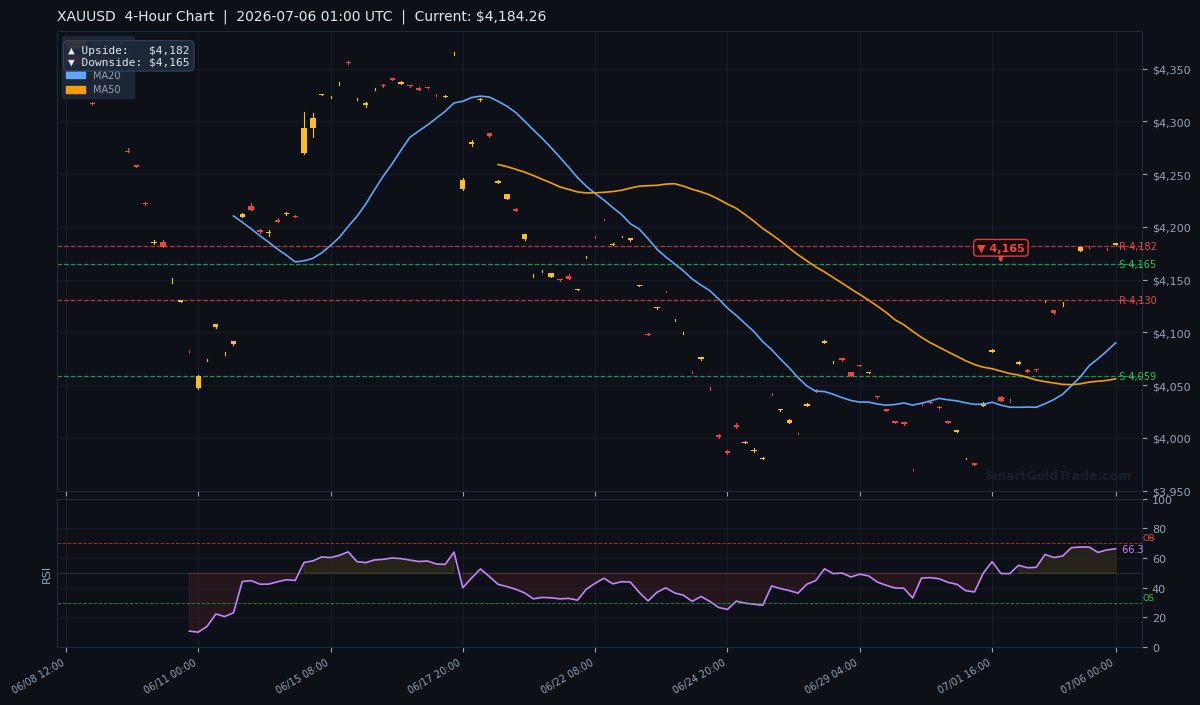
The 4‑hour chart shows MA20 at $4,090.09 and MA50 at $4,055.98, both sloping higher and confirming short‑term bullish momentum. Price trades well above both averages, which now serve as dynamic support layers. The MA200 sits far above at $4,290.36 — a sobering reminder that the daily trend remains bearish territory. Bulls need to reclaim the 200‑day average before the macro picture turns truly positive.
RSI and Momentum
The 14‑period Relative Strength Index reads 66.3 — firmly neutral but leaning bullish. It is not yet overbought, meaning there is room to run if fundamentals cooperate. A push above 70 would add conviction, but right now the oscillator simply confirms that momentum is steady, not exhausted. Any dip toward 60 would offer a healthier re‑entry for late buyers.
Key Price Levels
Immediate structure paints a compelling map. Support S1 arrives at $4,182.58, with S2 at $4,164.51. Yesterday’s Resistance R1 at $4,181.55 has been breached, effectively flipping into a support zone that must hold for the bullish bias to persist. The second resistance $4,139.37 lies far below current price — a leftover pivot from a prior period — and is unlikely to play a role today.
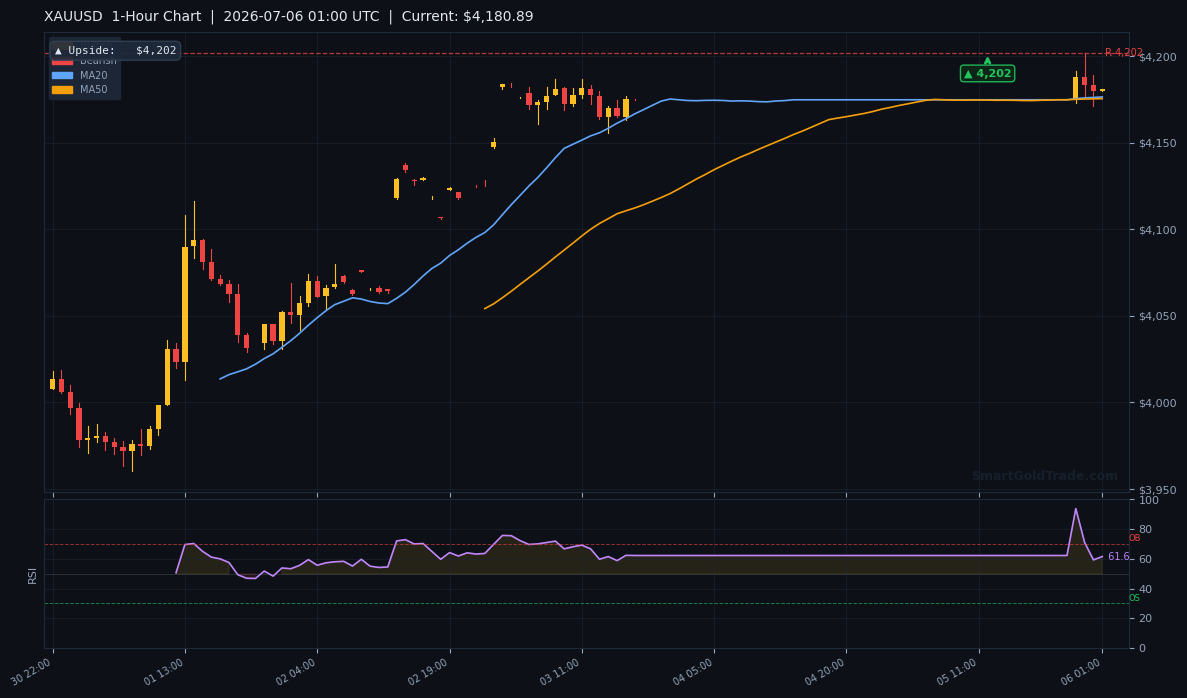
The 14‑period ATR of $20.24 suggests an expected daily range of roughly $4,164 to $4,204, though Asian hours typically deviate less than half that amount. Pivot arrows mark a clear 1‑hour upside target at $4,202 and a 4‑hour downside reference at $4,165.
| Level | Price | Role |
|---|---|---|
| Current Price | $4,184.26 | — |
| R1 (pivot) | $4,181.55 | Broken resistance → support |
| S1 | $4,182.58 | Immediate support |
| S2 | $4,164.51 | Deeper support |
| 1‑Hour Target | $4,202 | Bullish objective |
| 4‑Hour Downside | $4,165 | Bearish pivot |
Fundamental Drivers
Today’s marquee event is the ISM Services PMI, scheduled for 10:00 AM Eastern. The forecast stands at 54.2, slightly below the previous 54.5. A reading below 54 would signal a slowdown in the services sector and likely weaken the U.S. Dollar, offering gold a lift toward the $4,202 resistance. Conversely, a print above 55 would underscore economic resilience, push Treasury yields higher, and pressure gold back below $4,182. The most likely outcome is a number near the forecast, keeping price action choppy and range‑bound.
Key Event to Watch
The ISM Services PMI is the single most important trigger this week before the FOMC minutes on Wednesday. Gold’s reaction function is straightforward: weak data = dollar down, gold up; strong data = dollar up, gold down. Given that the index has been declining for three months, another soft figure could finally convince traders that a rate cut is coming, breaking gold out of its 4‑hour channel toward $4,210. Traders who avoid the Asian drift will have their real opportunity anchored to this release.
Devil's Advocate
The bullish outlook collapses if the ISM report surprises aggressively to the upside — say above 55.5. In that scenario, the U.S. Dollar would jump, yields would spike, and gold would almost certainly test $4,164. A decisive close below $4,164.51 (S2) would open the door to $4,140 and shift the short‑term bias back to bearish. The real danger is a false breakout above $4,202 that sucks in late longs before a vicious reversal. In thin Asian liquidity, those traps have sharper teeth. For Shariah-compliant traders, every decision is about capital preservation, not speculation—making these levels all the more important.
Trading Strategy for Asian Session
With light volume, the most sensible approach is to wait for a retest of the broken resistance‑turned‑support zone near $4,182. A buy limit order around $4,183 with a stop loss below $4,164 (slightly beyond S2) offers a 1.8 R:R using the 1‑hour target of $4,202. Traders seeking precision can scale into the position between $4,182 and $4,185, keeping the stop at $4,162 to respect ATR volatility. First take‑profit sits at $4,202, trailing the stop to break‑even once $4,195 is breached. Aggressive scalpers may book partials at $4,200 ahead of the ISM release.
For those who prefer a systematic edge, professional gold trading signals can refine entry timing during volatile news windows. Meanwhile, the SmartGoldTrade platform allows traders to execute spot positions with physical ownership and zero leverage, a genuine advantage for risk‑averse participants. Every lot represents one troy ounce of allocated gold, not a CFD — a structure that aligns with halal gold trading principles and long‑term capital preservation.
For longer-term investors, watching the gold price swings provides an opportunity to allocate into Shariah-compliant vehicles. SmartGoldTrade’s Islamic partnership investment pools let you earn profit shares based on gold’s performance over 6 months to 3 years, without the stress of daily chart-watching.
Key Takeaways
- Gold price consolidates near $4,184 after Friday’s NFP miss, with thin Asian liquidity keeping ranges tight.
- The MA20 ($4,090.09) and MA50 ($4,055.98) point higher, but the MA200 ($4,290.36) caps the daily chart.
- Immediate support sits at $4,182.58 (S1), with deeper protection at $4,164.51 (S2).
- Resistance is clustered at $4,202, a 1‑hour pivot target that must break for momentum to accelerate.
- The ISM Services PMI (forecast 54.2) is the session catalyst — a weak print could push gold to $4,210, while a strong number risks a drop to $4,164.
- A stop‑loss below $4,164 and a target of $4,202 define a clean, ATR‑based risk setup for the Asian session.
- Long-term Shariah-compliant investors can accumulate physical gold or profit-sharing plans on dips, harnessing gold price upswings without the stress of intraday moves.
Gold Price Outlook and Key Levels
The next 12 hours will likely be a waiting game. Gold price is technically well‑positioned on the 4‑hour timeframe, but it cannot ignore the gravitational pull of the 200‑day moving average at $4,290. A break above $4,202 on ISM weakness would put $4,210 in play and signal that the recovery from last month’s plunge is still intact. If the data disappoints, the floor at $4,164 will be tested quickly. Patience now sets up the high‑probability trade later. Let the news deliver the signal, not the low‑liquidity noise. For those following Islamic finance principles, every price level is a reminder to seek value without interest or leverage—a discipline that sharpens decision-making.
FAQ
What is the current gold price?
Gold is trading at $4,184.26 as of the Asian session on July 6, 2026.
Which support level must hold for the bullish bias to continue?
The immediate support zone between $4,182.58 (S1) and $4,181.55 (converted former resistance) is crucial. A break below exposes $4,164.51 (S2).
How could the ISM Services PMI move the gold price?
A reading below the forecast of 54.2 weakens the USD and could lift gold toward $4,202 or even $4,210. A strong print above 55 strengthens the dollar and may push prices down to $4,164.
Risk Disclaimer: Trading Gold (XAU/USD) carries significant risk of loss and is not suitable for all investors. This content is for informational purposes only and does not constitute financial advice. Always conduct your own research and trade responsibly.