Gold Price Market Overview
Macro Context
The dollar index (DXY) is pressing toward 105.8 this morning, backstopped by a 10-year Treasury yield hovering at 4.52%. The macro narrative has flipped swiftly: last week's oil price spike — a $7 surge in three sessions — forced Fed funds futures to price out an autumn rate cut entirely. Gold price typically thrives on inflation scares, but not when they come exclusively from supply-side energy shocks that central banks cannot easily cushion. The result is a dollar bid that is suffocating gold's safe-haven appeal. Geopolitically, tensions in the Strait of Hormuz remain a tail risk, but for today, the bond market is the only driver that matters.
Session Outlook
The American session opens with a bearish tilt, with gold price at $4,008.43 as of 20:30 UTC. Thin pre-London liquidity already knocked price below the 20-period moving average, and US desks are unlikely to chase a recovery without a meaningful negative surprise in claims data. The range for today is defined by the ATR: $12.14 either side of the open. A clean break below $4,000 would trigger stop-loss clusters, while any rally toward $4,025–$4,031 will attract fresh shorts. Traders should watch the S&P 500 open — if equities sell off on oil fears, gold could catch a brief bid, but I expect that bid to fail near the MA20.
Technical Analysis
Moving Average Structure
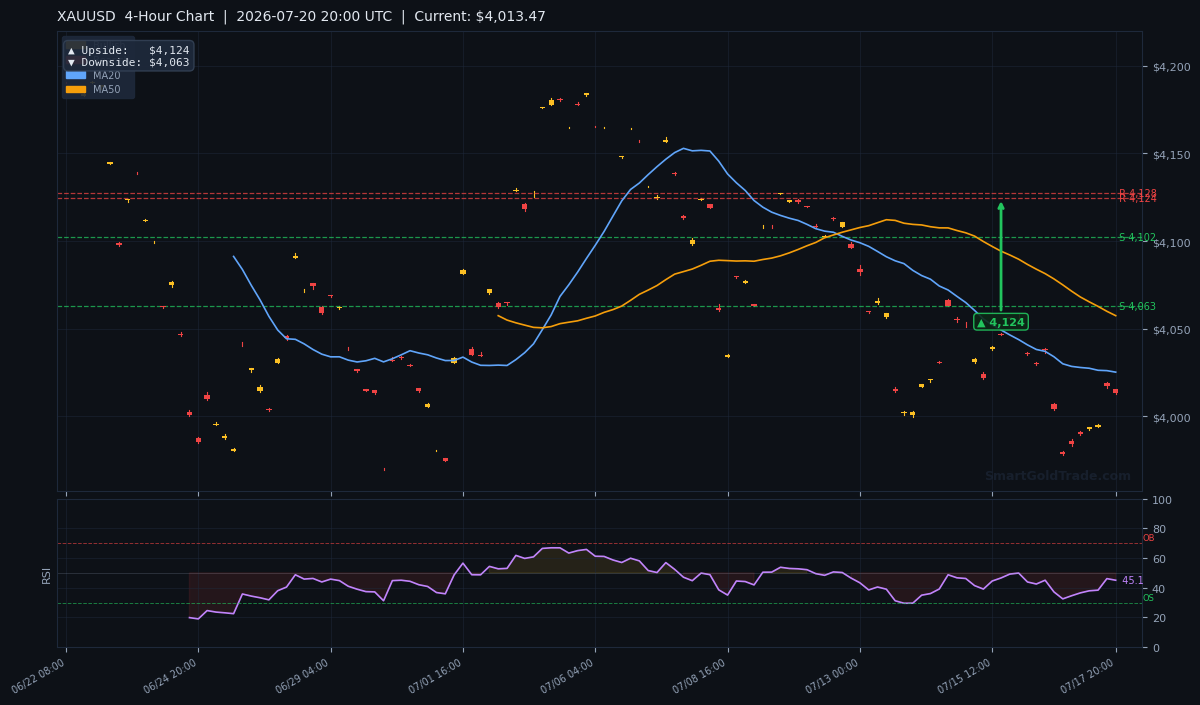
The 4-hour chart is unequivocal: price is below all three core moving averages. The MA20 sits at $4,025.26, acting as immediate resistance. The MA50 at $4,057.47 reinforces any bear flag that develops, and the MA200 at $4,159.27 looms far overhead — gold is in bear territory on the medium-term timeframe. The EMA structure confirms it: MA20 is below MA50, a configuration that typically accelerates selling. Until price closes a 4-hour candle above $4,057, any rally is a shorting opportunity.
RSI and Momentum
The 14-period RSI reads 45.1, squarely in neutral territory. That's deceptive; in a downtrend, neutral RSI often marks the pause before the next leg lower, not a rebound signal. There is no divergence yet. The RSI has room to fall before hitting oversold levels below 30, meaning momentum traders have a green light to stay short. I will only consider a contrarian long if the RSI dives below 30 on a daily closing basis, which would align with a test of $4,000.
Key Price Levels
Support S1 at $4,147.61 has already been broken cleanly, leaving S2 at $4,124.26 as the last intraday floor before the psychological $4,000. Resistance R1 at $4,164.23 and R2 at $4,159.15 form a tight ceiling that won't be tested today. The daily ATR of $12.14 projects an expected session band of $4,001–$4,025, though a volatility expansion could stretch that toward $4,000–$4,031.
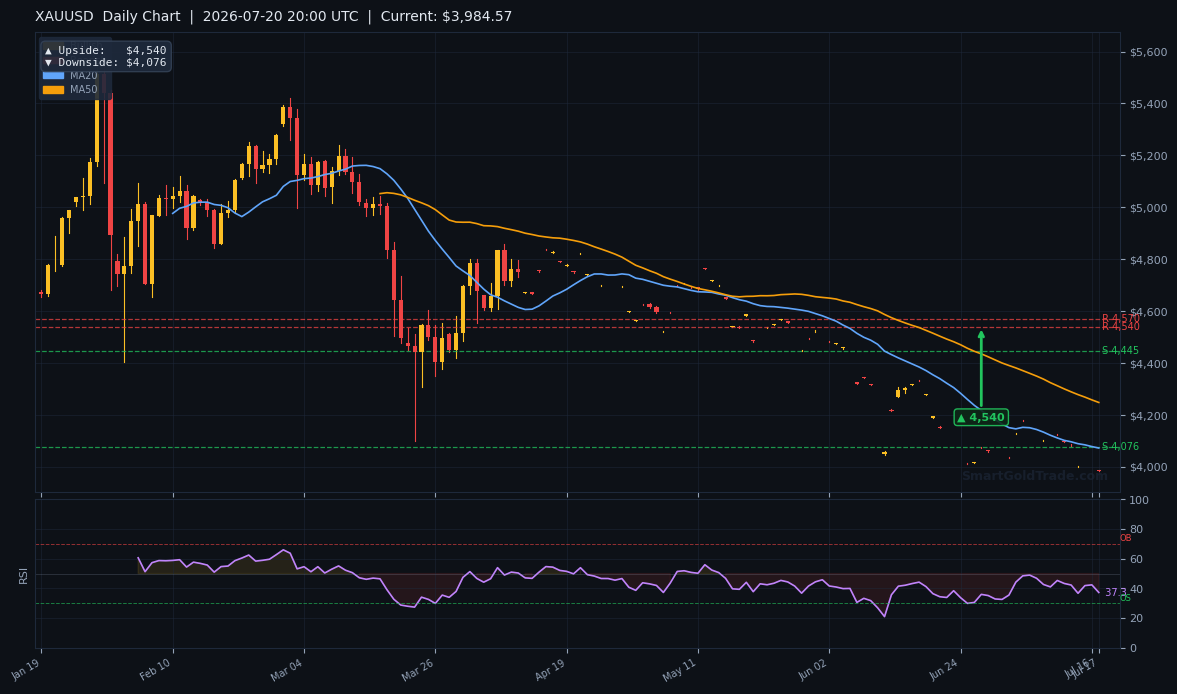
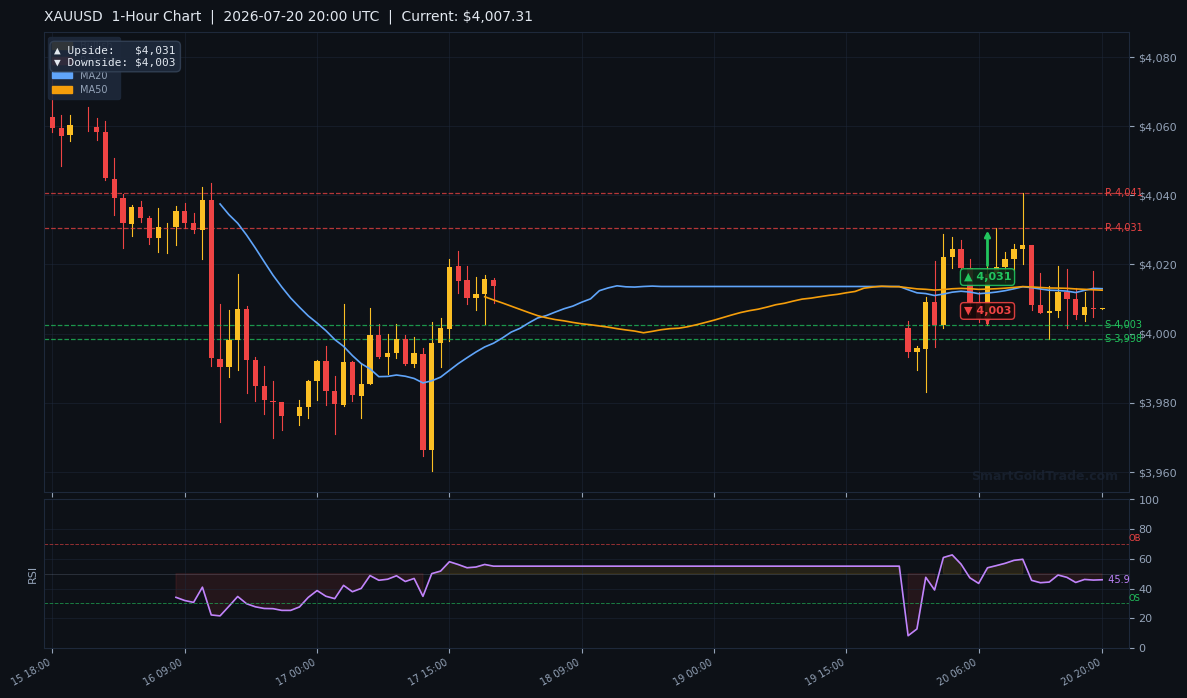
The arrows on the charts mark the mechanical targets: daily downside at $4,076, 4-hour downside at $4,063, and 1-hour downside at $4,003. The $4,063 level is the highest-probability magnet for the American session. A test of the $4,000 round number, while bearish on the charts, often invites physical gold accumulation from Islamic investors who see it as a long-term entry point.
| Timeframe | Bullish Target | Bearish Target |
|---|---|---|
| Daily | $4,540 | $4,076 |
| 4-Hour | $4,124 | $4,063 |
| 1-Hour | $4,031 | $4,003 |
Fundamental Drivers
Last week's oil shock is the dominant catalyst. Brent crude breaking above $92/bbl was driven by OPEC+ supply cuts and escalating rhetoric from Iran, and that energy price impulse is now filtering into headline PPI expectations. The problem for gold bulls is that the Fed has repeatedly stated it views supply-side inflation as transitory and is willing to hold rates high to crush demand-side components. The CME FedWatch Tool shows a 72% probability of a hold in September, up from 55% a week ago. That repricing has lifted real yields, making zero-yielding gold comparatively less attractive. Real yields on 10-year TIPS have climbed to 2.0%, a level that historically weighs heavily on gold price.
Key Event to Watch
This week's main event is Thursday's US advance GDP estimate for Q2. The consensus is 2.1% annualized. A print above 2.5% would reinforce the 'higher-for-longer' narrative and could send gold price below $4,000. A miss below 1.5% would revive rate-cut bets and could trigger a sharp short squeeze toward $4,124. Until then, the American session will trade the oil/Fed feedback loop and any unexpected Fedspeak.
For long-term Shariah-compliant investors, the current gold price weakness can be an opportunity to build positions in physical bullion. SmartGoldTrade's physical gold store offers 22K coins and 24K bars with pricing directly tied to the spot rate, allowing you to accumulate gold without riba or speculation. Even if the price slides to $4,000, those holding physical metal can ride out short-term volatility while maintaining full ownership. Building a position during declines can help Shariah-compliant investors dollar-cost average into a trusted store of value.
Devil's Advocate
The bearish setup fails if the dollar index reverses below 105.0 on profit-taking. A sudden risk-off wave — perhaps triggered by a missile incident in the Gulf — would override the rate dynamic and propel gold toward S1 at $4,147.61. A daily close above $4,057.47 (the MA50) would flip the bias from bearish to neutral and force me to cover shorts. The most immediate invalidation level is the 1-hour upside target at $4,031; if price clears that with volume, scalpers will chase a gap fill to $4,063 as support. Moreover, any escalation in the Strait of Hormuz that threatens oil supply could rapidly flip the dollar-gold correlation, pushing gold price toward $4,147 as safe-haven flows return. However, such a shock remains a low-probability event, and fading rallies continues to be the higher-probability trade.
Trading Strategy for American Session
I am looking to sell rallies into the $4,025–$4,031 zone, which aligns with the MA20 and the 1-hour upside target. My stop-loss goes above $4,060, just beyond the MA50, risking roughly $35 — less than 3x the hourly ATR, which is acceptable. The first take-profit level is $4,063, the 4-hour downside target, offering a 1:1.1 risk-reward at minimum. A more aggressive second target is $4,003, the 1-hour downside arrow, which matches a move just beyond the daily ATR. I will trail stops to entry after the first target is hit. This is a momentum trade, not a value bet, so I want confirmation from a break of the session low before adding size. If price instead spikes above $4,060 on strong volume, the trade is over and I step aside.
For those seeking a no-leverage, Shariah-compliant way to execute spot gold trades, halal gold trading on SmartGoldTrade offers direct ownership with zero swaps. I also use professional gold trading signals to cross-check entry timing during volatile US hours.
Key Takeaways
- Gold price is under the MA20 ($4,025), MA50 ($4,057), and MA200 ($4,159) — full bearish alignment.
- The 4-hour downside target at $4,063 is the highest-probability magnet this session.
- RSI at 45.1 leaves ample room for further decline before oversold conditions appear.
- An ATR of $12.14 implies a session band of $4,001–$4,025; a break above $4,031 invalidates the short setup.
- Oil-driven inflation is backfiring for gold by reinforcing hawkish Fed expectations.
- Thursday's GDP print above 2.5% could accelerate the drop toward $4,000.
Gold Price: Conclusion
The gold price is fighting gravity on July 20. Oil fear normally lifts bullion, but today it's lifting the dollar and bond yields instead. The technical picture is brutally simple: every moving average is overhead, momentum is pointing lower, and the chart arrows funnel toward $4,063. I am bearish for the American session and will sell any rally that stalls at $4,025. The only thing that changes my mind is a daily close above the MA50 at $4,057 — until then, bears control the tape. Thursday's GDP number looms large, but in the here and now, the trade is short, the target is $4,063, and the risk is well-defined.
Frequently Asked Questions
- Why is gold price dropping despite rising oil prices?
- The oil surge is fueling dollar strength and hawkish Fed repricing, which pressures non-yielding gold. The 10-year yield at 4.52% is making cash and bonds more attractive than bullion.
- What is the key support level for gold today?
- Immediate support is S2 at $4,124.26, but the critical downside magnet is the 4-hour target at $4,063. A break below that exposes $4,003.
- When would the bearish outlook be invalidated?
- A 4-hour close above the MA50 at $4,057.47 would flip the bias to neutral. A rally through $4,124 would signal a trend reversal.
- What economic event could move gold price this week?
- Thursday's Q2 GDP estimate is the big one. A reading above 2.5% could send gold to $4,000, while a miss below 1.5% could trigger a short squeeze toward $4,124.
- How should I manage risk on a short trade today?
- Use the ATR of $12.14 to set a stop no tighter than $35–$40 from entry. A stop above $4,060 protects against a false breakout, keeping risk within 3x the hourly range.
Risk Disclaimer: Trading Gold (XAU/USD) carries significant risk of loss and is not suitable for all investors. This content is for informational purposes only and does not constitute financial advice. Always conduct your own research and trade responsibly.