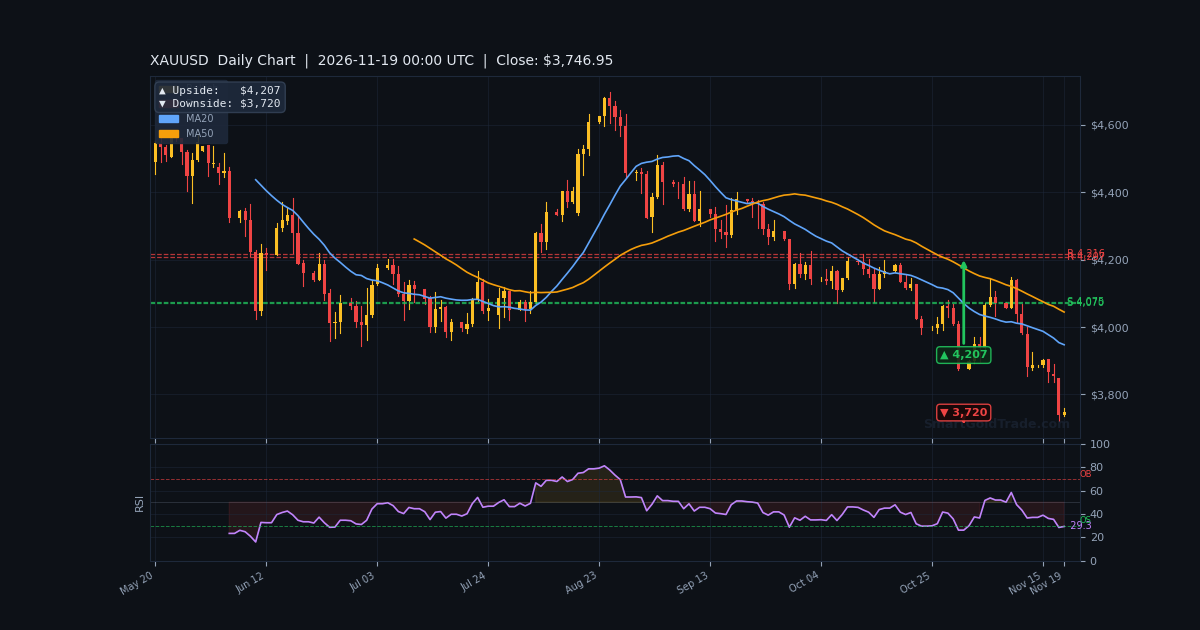
The gold price is holding near $3,754.94 in early Asian trading on Thursday, November 19, 2026, after a brutal selloff driven by hawkish Federal Reserve signals. The metal slumped to its lowest level since September 2025 on Wednesday as Fed meeting minutes revealed most officials see further rate hikes ahead.
Minneapolis Fed President Neel Kashkari added fuel to the fire, stating markets believe the central bank will need to hike more than officials currently expect. That commentary keeps real yields and the dollar bid, a toxic combination for a non-yielding asset.
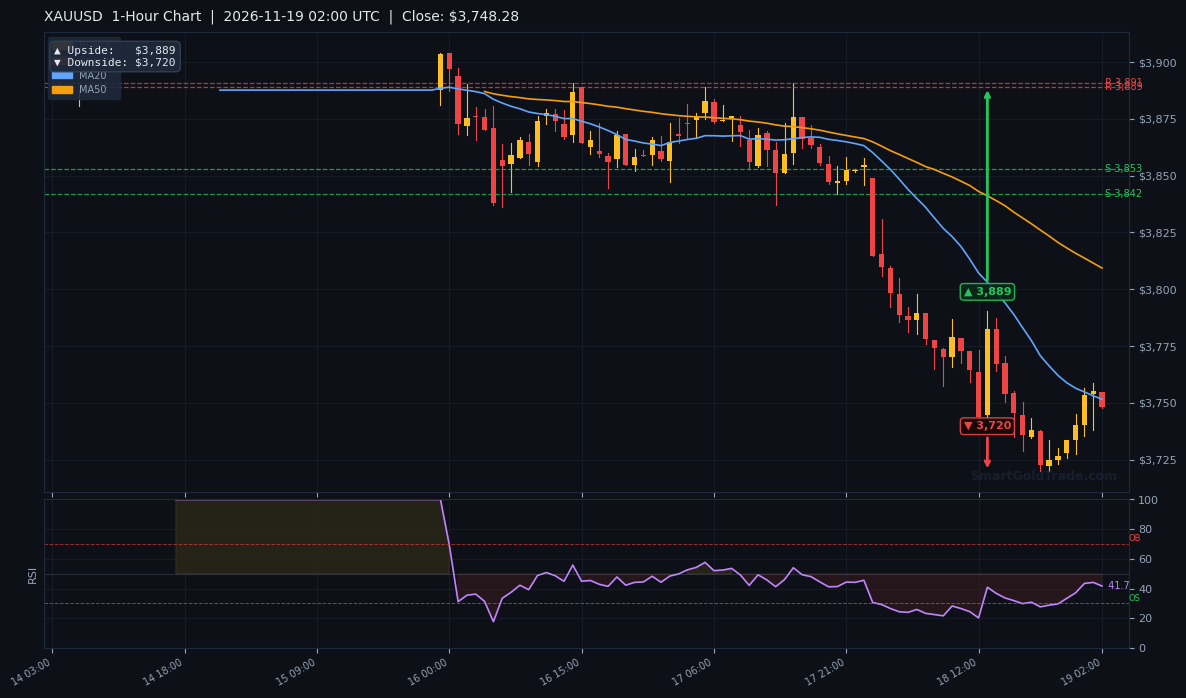
With liquidity thin and volatility compressed into a tight $3,737.89–$3,758.56 band, this session is about preparation, not chasing. The $3,719.89 floor is the line that matters.
Gold Market Overview
Macro Context
The macro backdrop remains a clear headwind. The 10-year TIPS real yield sits at 2.89%, up 0.23 week-over-week, while the 10-year nominal yield holds at 5.10%. The broad dollar index is at 122.7, rising 1.1 on the week — a direct weight on the gold price.
Positioning offers a cautionary signal. COT data shows non-commercial gold futures net long at +190,107 contracts, meaning speculators remain heavily exposed to the long side even as price breaks down. SPDR GLD holdings rose 2.6 tonnes day-over-day to 1,048.7 tonnes, a modest inflow that has not been enough to stem the decline.
News sentiment reads -0.29, mixed but leaning negative. The dominant narrative is Fed hawkishness: Fed Governor Christopher Waller reiterated support for a half-point hike in December, and markets now price roughly a 90% chance of a 25-basis-point move next month.
Session Outlook
Asian session liquidity is thin, and the ATR(14) of $18.24 suggests an expected hourly range near 0.49% of price. Expect chop between $3,737.89 and $3,758.56 unless a headline forces a break.
The daily open at $3,728.48 is up 0.71%, but the weekly open at $3,866.49 shows a -2.89% loss — the market is bouncing inside a larger decline, not reversing it. Watch the $3,719.89 pivot for direction.
Technical Analysis
Moving Average Structure
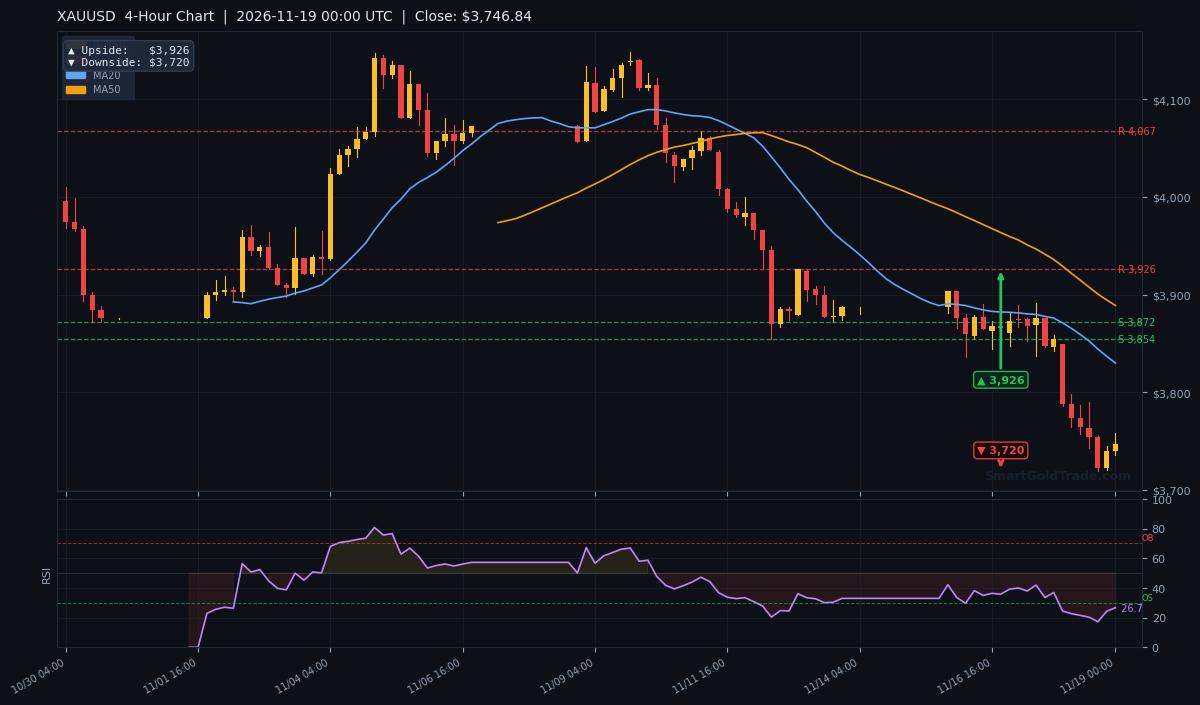
The trend structure is bearish across every timeframe. Price at $3,754.94 trades below the EMA20 at $3,759.93, below the EMA50 at $3,799.76, and far beneath the EMA200 at $3,906.36. On the H4, the close is $3,755.19 with the EMA50 at $3,898.34 and EMA200 at $4,039.25.
The daily close at $3,754.96 sits below the daily EMA50 at $4,074.01 and EMA200 at $4,228.83. Every moving average above price confirms a downtrend, not a dip.
RSI and Momentum
RSI(14) on the H1 reads 43.6, neutral but recovering from oversold territory. The H4 RSI at 29.2 and D1 RSI at 32.7 both sit in oversold range, which explains the current pause. Stochastic is at 42.1/28.0, curling upward from the low.
MACD on the H1 is -21.06 with signal at -24.46 and a positive histogram of +3.40 — a mild bullish divergence that supports a bounce, not a reversal. ADX at 36.6 confirms a strong trend, with -DI 25.2 above +DI 17.98. VWAP at $3,746.55 sits just below current price, a mild intraday bullish tilt.
Fundamental Drivers
Wednesday's Fed minutes are the dominant driver. Most officials favored no change in October but considered additional hikes acceptable, and Waller's call for a possible half-point move in December hardened the market's hawkish stance. The gold price fell to a 14-month low on the release.
Deutsche Bank noted a mixed US data run: retail sales rose +0.2% in October versus +0.1% expected, while industrial production unexpectedly fell -0.4% and the NAHB housing index dropped to 25, its lowest since 2012. That softness has not been enough to shift the Fed's inflation focus.
Real yields at 2.89% and the dollar at 122.7 remain the structural anchors. StoneX notes the metal is stretched and vulnerable to a sharp rebound, but stretched does not mean reversed.
Key Event to Watch
No high-impact USD events sit in the immediate future, so the next catalyst is December Fed pricing. With a 90% probability of a 25-basis-point hike already priced, any softening in that expectation would be the first real bullish spark for the gold price. Traders can track such shifts with professional gold trading signals that flag institutional positioning changes.
Unified Technical & Fundamental Outlook
Both pillars are bearish and aligned. The technical score of -0.75 reflects a bearish H1 trend, price below the EMA200, and EMA20 below EMA50. The fundamental score of -0.31 reflects rising real yields, a rising dollar, and negative news sentiment.
The combined assessment is BEARISH at -0.53 with ALIGNED_BEARISH status. The strongest confluence is the trend and yield backdrop: price below every major moving average while real yields climb. The one offset is GLD inflows and a heavily net-long COT position, which raises squeeze risk on any dovish surprise. Neither is enough to flip the bias today.
Devil's Advocate
The bearish case could fail if price reclaims $3,790.54 (R1) and holds above the EMA20 at $3,759.93 on a closing basis. That would signal the oversold bounce has legs and put $3,886.69 (R2) in play.
The bigger risk to bears is positioning. With speculators net long +190,107 contracts and the H4 RSI at 29.2, a hawkish surprise is largely priced. Any hint of a slower hike path could trigger a violent short squeeze toward $3,857.49. A daily close above that level would flip the trade.
Trading Strategy for Asian Session
With liquidity thin, patience beats aggression. The cleanest setup is a short from the $3,759.93 EMA20 or the $3,790.54 R1 zone, with a stop above $3,799.76 — roughly one ATR of $18.24 plus a buffer. First target is $3,719.89 (S1 and the daily downside pivot), second target $3,715.37 (Bollinger lower band).
For contrarian longs, wait for a reclaim of $3,759.93 with volume above the 33,118 SMA20. Entry near $3,754.96, stop at $3,737.89 below the session low, target $3,790.54. Do not chase either direction in the current $3,737.89–$3,758.56 chop.
If you prefer physical exposure to trading the noise, you can buy certified gold coins and bars as a longer-term store of value rather than fighting a bear trend intraday.
Key Takeaways
- The gold price holds $3,754.94, below the EMA20 at $3,759.93 and EMA200 at $3,906.36 — a confirmed bear structure.
- H1 RSI at 43.6 is neutral, but H4 RSI 29.2 and D1 RSI 32.7 are oversold, supporting a pause not a reversal.
- Real yields at 2.89% and the dollar at 122.7 remain the dominant headwinds.
- Key support is $3,719.89; a break opens $3,715.37 and the daily downside target of $3,719.89.
- Resistance sits at $3,790.54 (R1) and $3,886.69 (R2); a close above $3,857.49 would flip the bias.
- Expected session range is roughly $18.24 based on ATR, so avoid chasing moves in thin liquidity.
Conclusion
The gold price is pausing, not recovering. Both technical and fundamental pillars are aligned bearish at a combined score of -0.53, and the trend structure below every major moving average keeps sellers in control. The immediate battle line is $3,719.89; a clean break targets $3,715.37, while a reclaim of $3,759.93 opens $3,790.54.
Asian liquidity is thin, so the disciplined play is to wait for the $3,719.89 test or a failed bounce into resistance. Prepare the levels, size positions for the $18.24 ATR, and let the market come to you rather than chasing a stretched oversold bounce.
Frequently Asked Questions
- What is the gold price right now?
- The gold price is $3,754.94 in the Asian session on November 19, 2026, holding above the $3,719.89 support level.
- Is gold oversold enough to buy?
- H4 RSI at 29.2 and D1 RSI at 32.7 are oversold, but the H1 RSI at 43.6 is neutral. A bounce is possible, but a confirmed reversal needs a close above $3,790.54.
- What are the key support and resistance levels for gold today?
- Support sits at $3,719.89 (S1) and $3,715.37 (Bollinger lower). Resistance is $3,790.54 (R1) and $3,886.69 (R2).
- Why is the gold price falling in November 2026?
- Hawkish Fed minutes, a 10-year real yield at 2.89%, and a dollar index at 122.7 are pressuring the metal. Markets price a 90% chance of a December rate hike.
- What would change the bearish outlook for gold?
- A daily close above $3,857.49 (PDH) or a shift in December Fed pricing away from a hike would weaken the bearish case and target $3,886.69.
Risk Disclaimer: Trading Gold (XAU/USD) carries significant risk of loss and is not suitable for all investors. This content is for informational purposes only and does not constitute financial advice. Always conduct your own research and trade responsibly.