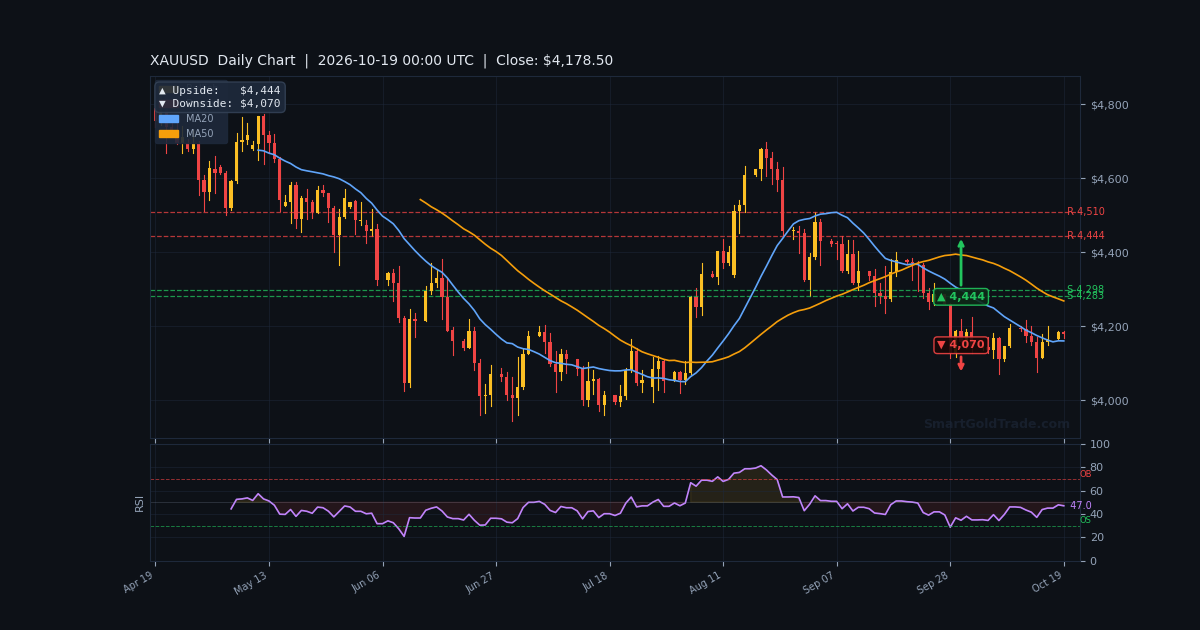
The gold price is holding at $4,174.24 in the Asian session, consolidating just below the $4,179.69 resistance that has capped the market since Friday. This quiet drift follows last week's hot PPI inflation print and Fed Chair Kevin Warsh's IMF appearance, where he declined to signal the October 27–28 policy path. With liquidity thin and no fresh catalyst on the calendar, the metal is coiling inside a $4,168–$4,180 band. Traders should prepare for a breakout rather than chase the current drift — the first clean close above $4,180 or below $4,168 will set the tone for the London open.
Gold Market Overview
Macro Context
The dollar remains on the back foot after dropping to a two-week low on Friday, snapping a four-week winning streak. US Treasury yields fell sharply — the 2-year down 5.9bps to 4.74% and the 10-year down 12.7bps to 5.06% — as AI growth worries outweighed the hawkish inflation impulse. Fed Chair Warsh offered no guidance on the October 27–28 meeting, and CME FedWatch now shows an 83.9% probability of a hold, up from 49% a month ago. Geopolitical risk remains elevated: Iran has prepared a new retaliation plan, and attacks on commercial vessels near the Strait of Hormuz continue.
Session Outlook
Asian liquidity is thin, and the ADX reading of 14.0 confirms a weak, ranging market. Expect the gold price to chop between $4,168.57 and $4,179.69 until European desks arrive. Do not chase moves in this volume — false breaks are common. The first real trigger is the London open, followed by any headline on Middle East tensions or a shift in Fed hike odds.
Technical Analysis
Moving Average Structure
The gold price trades above all three key moving averages: EMA20 at $4,171.32, EMA50 at $4,163.94, and EMA200 at $4,162.84. This is a bullish structure, with the EMA20 acting as immediate dynamic support. The higher timeframes remain heavy — H4 EMA200 sits at $4,233.38 and D1 EMA200 at $4,295.09 — so the bounce is corrective until those are reclaimed.
RSI and Momentum
RSI(14) at 52.7 is squarely neutral, offering no directional edge. Stochastic at 51.6/50.0 confirms the same indecision, while MACD at 3.12 with a negative histogram of -0.58 shows fading upside momentum. Translation: the market is resting, not trending. Wait for RSI to break 60 for a long trigger or 45 for a short trigger before committing size.
Key Price Levels
Immediate support sits at S1 $4,168.57 and S2 $4,165.69. Resistance is at R1 $4,179.69 and R2 $4,184.39. The ATR(14) of $13.97 implies an expected hourly range of roughly 0.34%, so a move to either R1 or S1 is well within normal noise. Bollinger bands at $4,191.14 / $4,174.27 / $4,157.40 frame the wider envelope.
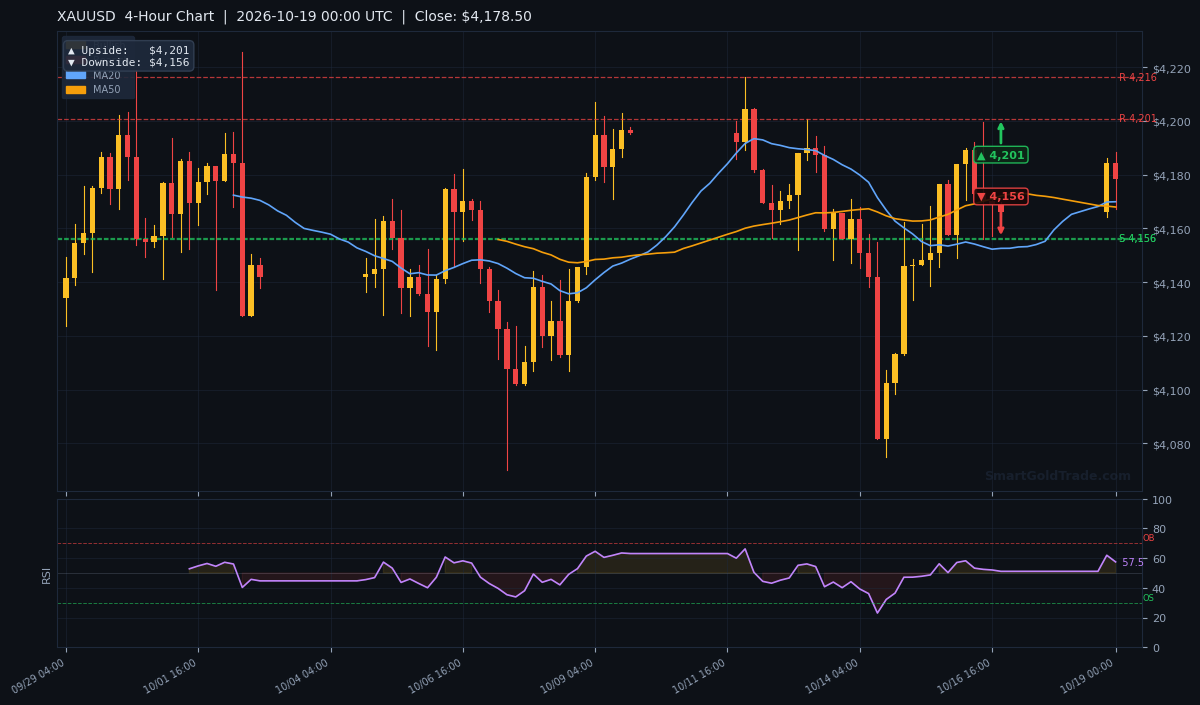
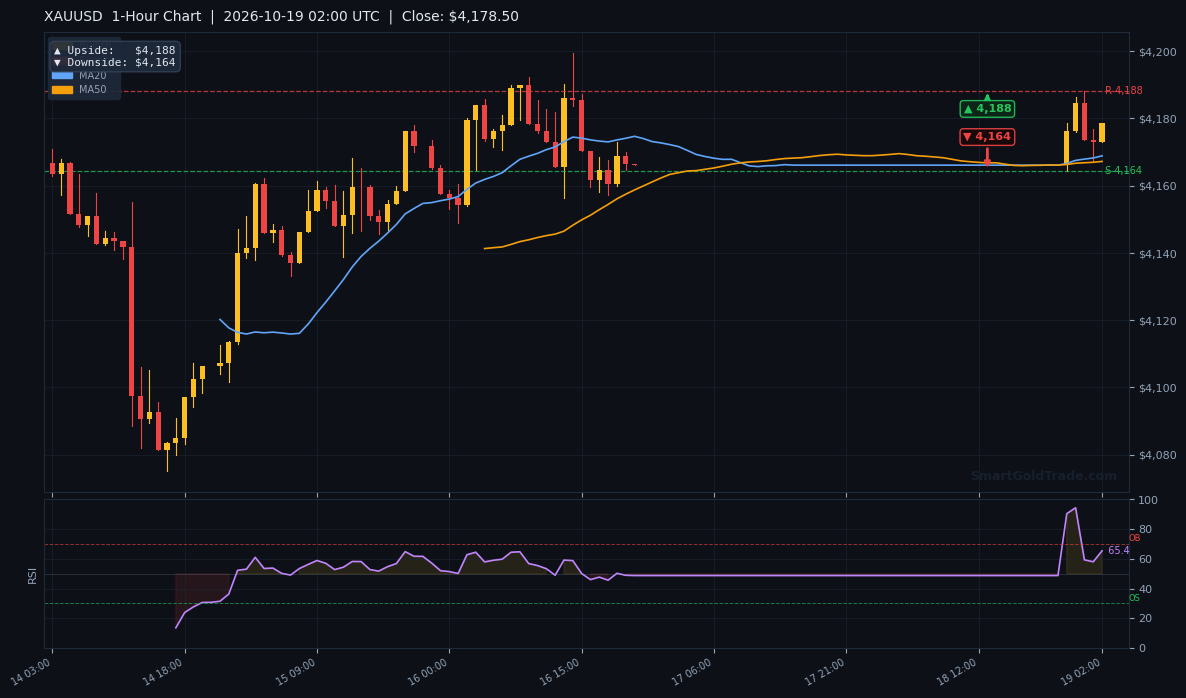
| Timeframe | Upside Target | Downside Target |
|---|---|---|
| Daily | $4,444 | $4,070 |
| 4-Hour | $4,201 | $4,156 |
| 1-Hour | $4,188 | $4,164 |
Fundamental Drivers
Last week's PPI print came in at +1.3% for September versus +0.6% expected — a huge upside surprise that should have lifted the dollar. Instead, yields fell, because AI growth concerns outweighed the inflation impulse. That divergence is the story: the market is pricing slower growth over hotter prices. Fed Chair Warsh's refusal to prejudge the October 27–28 decision has pushed hold odds to 83.9%.
Geopolitical risk is the wildcard. Iran's new retaliation plan and attacks near the Strait of Hormuz keep oil-inflation fears alive. Trump's diesel export deal with Russia and sanction waivers have temporarily eased oil, but any escalation would send the gold price higher on safe-haven demand.
Key Event to Watch
The October 27–28 FOMC meeting is the week's dominant event. A hold is 83.9% priced, so the risk is a hawkish surprise. Any hint of a December hike — currently 91.8% priced — would pressure the gold price toward $4,157.
Devil's Advocate
The bullish structure above the EMA200 is fragile. If the gold price closes below S2 $4,165.69, the EMA stack inverts and the H4 downside target at $4,156 comes into play. A hawkish Warsh follow-up or a stronger dollar would flip the bias quickly. Watch $4,168.57 — a clean break there invalidates the long setup and opens $4,164 and then $4,156.
Trading Strategy for Asian Session
With the gold price at $4,174.24 and ATR at $13.97, the session favors a range approach. For longs, wait for a pullback to $4,171 (EMA20) and enter with a stop at $4,164 (below S2 and the 1H downside pivot), targeting $4,179 then $4,184. For shorts, sell a rejection at $4,179.69 with a stop at $4,184.50 and a target of $4,168.
Do not chase a break of $4,180 in thin Asian volume — wait for a retest. Position size should be reduced given the weak ADX of 14.0. If you prefer to follow professional setups, professional gold trading signals can provide real-time entry and stop levels during the London session.
Key Takeaways
- Gold price holds $4,174.24, capped by R1 $4,179.69 and supported by S1 $4,168.57.
- RSI at 52.7 is neutral — no directional edge until 60 or 45 breaks.
- ADX at 14.0 confirms a weak, ranging market — avoid chasing breakouts.
- Fed hold odds at 83.9% for October 27–28; December hike odds at 91.8%.
- ATR of $13.97 implies a normal session range of roughly 0.34%.
- Key invalidation: a close below $4,165.69 flips the bias bearish toward $4,156.
Conclusion
The gold price is coiling at $4,174.24 with a mildly bullish structure above the EMA200 but no momentum to confirm it. The bias is neutral-to-long while $4,168.57 holds, with $4,179.69 the first hurdle and $4,184.39 the breakout target. A break below $4,165.69 flips the setup toward $4,156. Patience is the trade in this thin Asian session — let London confirm direction before committing size.
Frequently Asked Questions
- What is the gold price right now?
- The gold price is $4,174.24 in the Asian session, trading between support at $4,168.57 and resistance at $4,179.69.
- Is gold bullish or bearish today?
- Mildly bullish while above the EMA200 at $4,162.84. A close below $4,165.69 would flip the bias bearish toward $4,156.
- What are the key levels to watch?
- Resistance at $4,179.69 and $4,184.39; support at $4,168.57 and $4,165.69. The 1-hour pivot targets are $4,188 upside and $4,164 downside.
- What event could move gold this week?
- The October 27–28 FOMC meeting. A hold is 83.9% priced; any hawkish surprise would pressure the gold price toward $4,157.
Trading Gold (XAU/USD) carries significant risk of loss and is not suitable for all investors. This content is for informational purposes only and does not constitute financial advice. Always conduct your own research and trade responsibly.