The gold price is holding at $4,115.31 in the Asian session, and the chart tells a story of compression rather than conviction. Price sits below every major moving average on the hourly timeframe, with the EMA200 at $4,148.04 acting as a ceiling. Last week, Fed Chairman Kevin Warsh avoided signalling the outcome of this month's policy meeting, and the CME FedWatch tool now shows an 84% chance of no rate change at the October 28 decision. That uncertainty has kept bulls cautious. With liquidity thin and ADX at 18.3, this session favours patience over action. Traders should prepare for a range-bound Asian session and wait for a clean break before committing capital.
Gold Market Overview
Macro Context
The dollar remains firm as US Treasury yields hold elevated levels, pressuring non-yielding assets. Commerzbank noted that European equities declined amid political unrest in France while US yields rose, pushing the USD slightly higher. This combination weighs on the gold price because higher yields make yield-bearing assets more attractive relative to bullion.
Geopolitical risk in the Middle East remains a background factor. Iran's Foreign Minister Abbas Araghchi said Wednesday that Iran is committed to a peaceful resolution but fully prepared to defend itself. These tensions provide a floor under gold but have not been enough to spark fresh buying. Markets are pricing another rate increase at the December Fed meeting, keeping the policy outlook tilted toward tightening.
Session Outlook
Asian session liquidity is thin, and the gold price is likely to oscillate between $4,111.68 support and $4,127.01 resistance. The daily open at $4,139.38 is already 0.58% above current price, confirming the bearish tone. With ATR at $13.54, expect a session range of roughly $14–$18. Do not chase moves in this low-volume environment. The weekly US Initial Jobless Claims report due later today is the next catalyst.
Technical Analysis
Moving Average Structure
The gold price is trading below all three key moving averages on the H1 chart. The EMA20 sits at $4,125.70, the EMA50 at $4,130.26, and the EMA200 at $4,148.04. This stacked alignment confirms bearish structure. The H4 EMA200 at $4,216.53 and D1 EMA200 at $4,289.80 are far above, reinforcing the medium-term downtrend.
RSI and Momentum
RSI(14) reads 44.1, placing the gold price in neutral territory — neither oversold nor overbought. This means there is room for further downside without triggering a bounce. Stochastic shows 35.2/52.6, indicating mild bearish momentum. MACD at -1.08 with a histogram of -1.17 confirms the bearish bias. ADX at 18.3 signals a weak, ranging market — not a strong trend. Traders should wait for momentum confirmation before entering.
Key Price Levels
Immediate support rests at S1 $4,111.68, with S2 $4,110.87 just below. A break below S2 opens the door to $4,108, the 1-hour downside target. Resistance stands at R1 $4,127.01 and R2 $4,141.99. The Bollinger Bands show upper at $4,143.55, middle at $4,126.15, and lower at $4,108.76. VWAP at $4,118.23 sits just above current price, acting as a near-term magnet. ATR-based range for this session is approximately $14–$18.
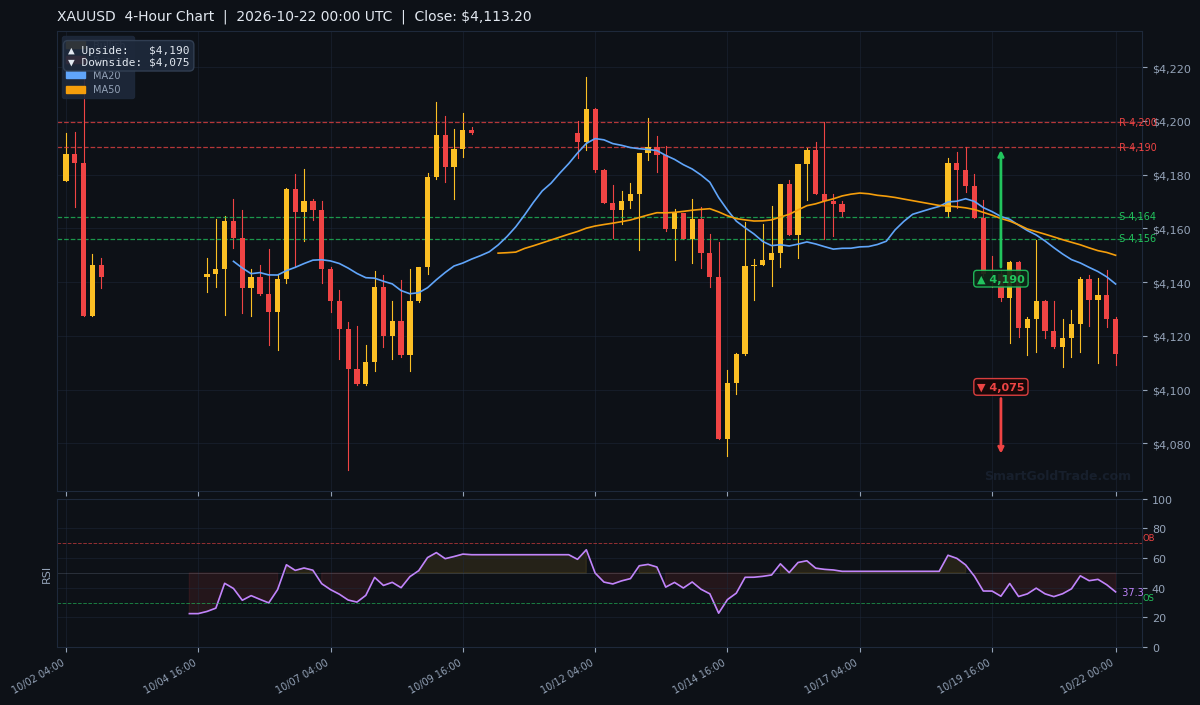
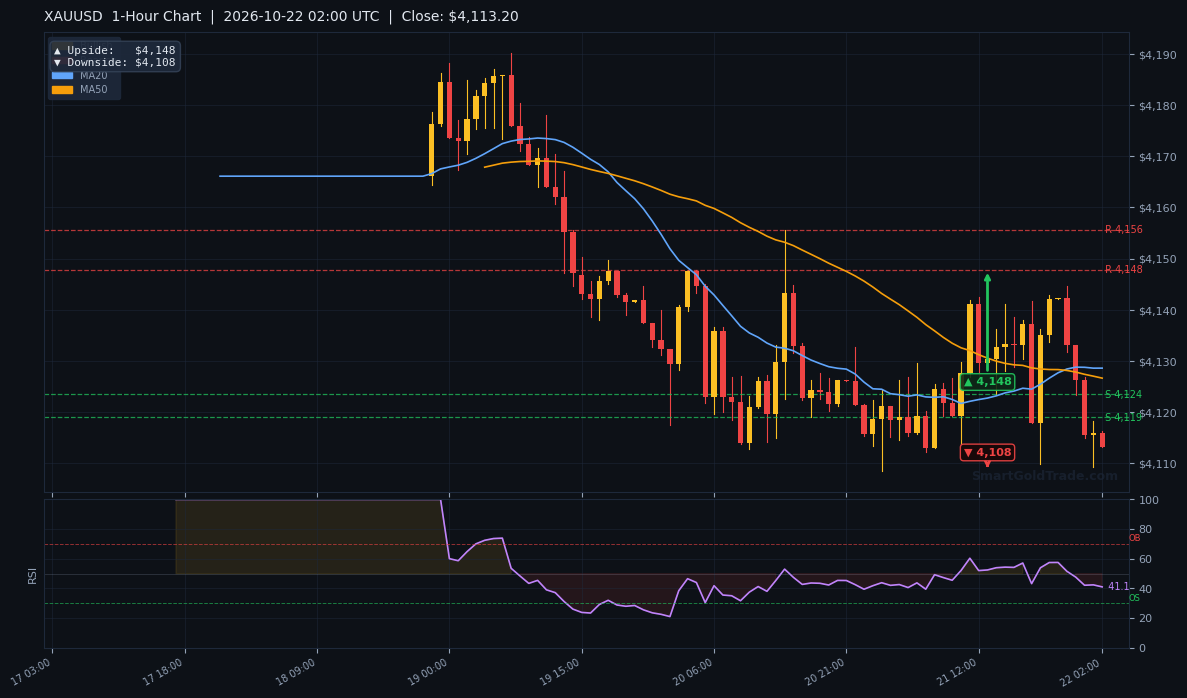
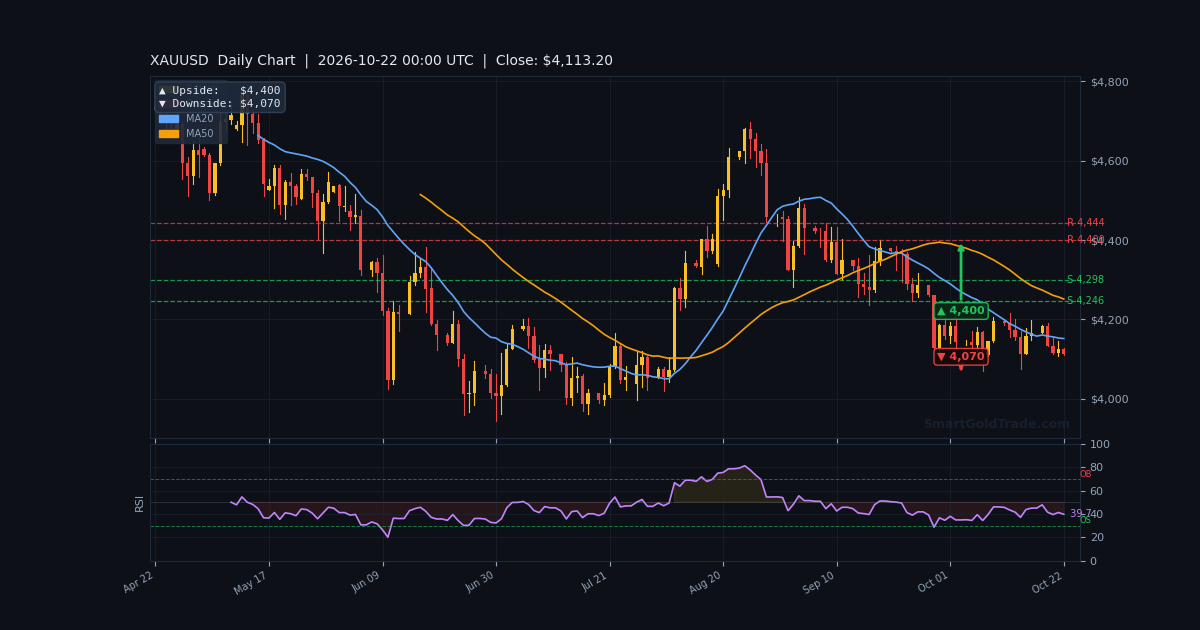
| Timeframe | Upside Target | Downside Target |
|---|---|---|
| Daily | $4,400 | $4,070 |
| 4-Hour | $4,190 | $4,075 |
| 1-Hour | $4,148 | $4,108 |
Fundamental Drivers
The gold price faces pressure from a firm dollar and elevated US yields. Last week's hotter-than-expected inflation data did not change Fed Chairman Warsh's assessment of the economy, but markets still price another hike in December. Higher rates weigh on gold because bullion pays no interest. Middle East supply risks keep a floor under prices, but risk appetite has stabilised in US assets, reducing safe-haven demand.
Key Event to Watch
The most important upcoming event is the Fed's rate decision on October 28. With an 84% chance of no change, the market has largely priced a hold. However, the December meeting outlook remains hawkish. Any signal from Warsh about future tightening could push the gold price below $4,111 support. Today's US Initial Jobless Claims report is the immediate catalyst for intraday moves. Traders can track professional gold trading signals for real-time alerts around these events.
Devil's Advocate
What could invalidate the bearish bias? A surprise escalation in Middle East tensions or a dovish shift in Fed rhetoric would flip the script. The key reversal level is R1 $4,127.01. A sustained break above this level, followed by a close above $4,141.99, would signal a shift in momentum and invalidate the short setup. Also, if RSI drops below 30, an oversold bounce could catch bears off guard. Watch the $4,108.76 lower Bollinger Band — a failure to break below it on volume would suggest exhaustion.
Trading Strategy for Asian Session
Given the weak ADX and thin liquidity, a range-bound approach is best. For a short trade, consider entry near $4,125.70 (EMA20) or on a rejection at $4,127.01 (R1). Place stop loss above $4,130.26 (EMA50) or roughly $14 above entry using ATR. Take profit targets: first at $4,111.68 (S1), second at $4,108.76 (lower Bollinger). For a long trade, wait for a bounce from $4,111.68 with confirmation, targeting $4,118.23 (VWAP) and $4,127.01 (R1). Stop loss below $4,110.87 (S2). Do not chase moves in low volume. If you prefer passive strategies, copy trading allows you to mirror experienced gold traders automatically. Position sizing should be conservative given the ranging conditions.
Key Takeaways
- Gold price trades at $4,115.31, below all key EMAs, confirming bearish structure.
- Immediate support at $4,111.68 (S1); a break opens $4,108.
- Resistance at $4,127.01 (R1) caps upside; a close above would flip bias.
- RSI at 44.1 is neutral, meaning room for further downside without oversold bounce.
- ADX at 18.3 signals weak trend — expect range-bound trading.
- Fed decision on October 28 is the next major catalyst; 84% chance of a hold.
Conclusion
The gold price is likely to remain under pressure in the Asian session, with $4,127.01 as the key level to watch on the upside and $4,111.68 on the downside. The bearish structure below the EMA200 and neutral RSI suggest a range-bound session with a downward tilt. Patience is the edge here — wait for a clean break of either level before committing. The upcoming Fed meeting on October 28 will set the tone for the weeks ahead. For those looking to build long-term exposure to physical metal, consider purchase physical gold as a hedge against policy uncertainty.
Frequently Asked Questions
- What is the gold price today?
- The gold price is $4,115.31 as of the Asian session open on October 22, 2026.
- What are the key support and resistance levels for gold?
- Support sits at $4,111.68 (S1) and $4,110.87 (S2). Resistance is at $4,127.01 (R1) and $4,141.99 (R2).
- Is gold oversold right now?
- No. RSI(14) at 44.1 is neutral, not oversold. A drop below 30 would signal oversold conditions.
- What is the Fed's expected rate decision?
- The CME FedWatch tool shows an 84% chance of no rate change at the October 28 meeting.
- What is the trading range for gold today?
- With ATR at $13.54, expect a session range of roughly $14–$18, between $4,111 and $4,127.
Trading Gold (XAU/USD) carries significant risk of loss and is not suitable for all investors. This content is for informational purposes only and does not constitute financial advice. Always conduct your own research and trade responsibly.