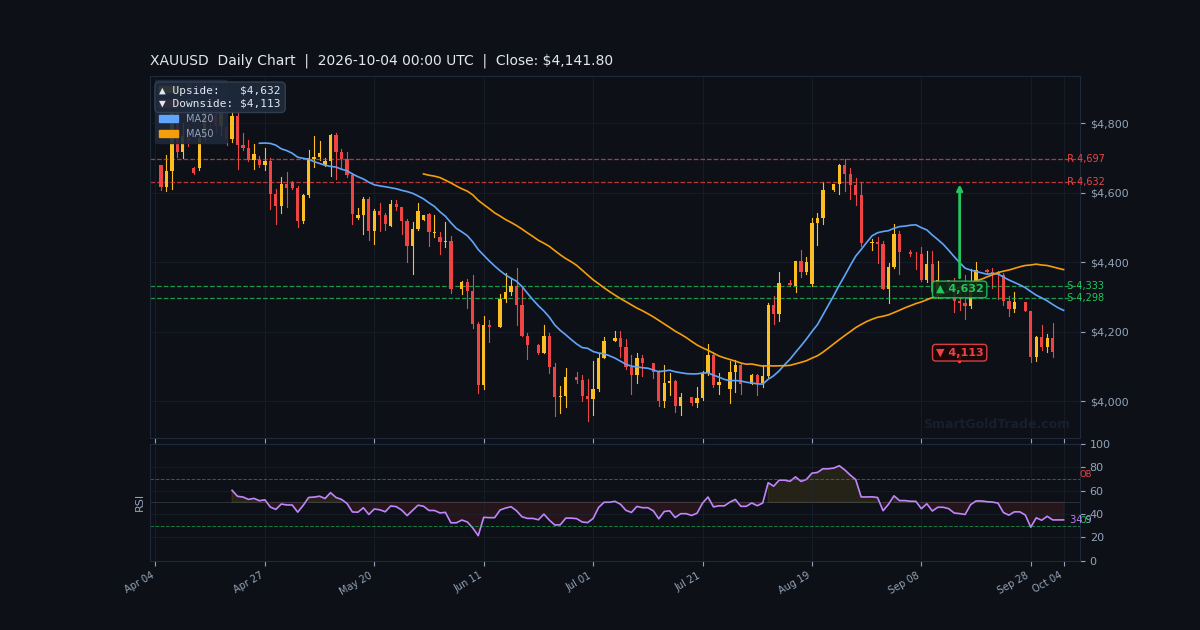
Gold trades at $4,141.80 per troy ounce as the new trading week opens, sitting just below a flattening 50-period average after a bruising stretch of failed upside attempts. This gold price forecast next week covers the October 04–10 window, when the metal sits in a coin-flip position between its moving averages. Last week's tape told a clear story: buyers defended the mid-$4,100s, but sellers capped every rally into the $4,200–$4,400 zone.
Below, I map the exact support and resistance levels that matter, the macro catalysts on deck, and the probability-weighted scenarios for XAU/USD. Every level is drawn from the live SmartGoldTrade price feed and pivot analysis, not guesswork.
Last Week in Review
Gold spent last week oscillating between hope and disappointment, ultimately finishing near where it started — pinned in the low $4,100s after a headline-grabbing push toward $4,400 faded.
Price Action Recap
The week opened with constructive momentum, as XAU/USD appreciated toward the $4,400 region while US Treasury yields retreated. That move proved to be the high-water mark.
By midweek, bears regained traction and gold drifted back toward the $4,300 handle, then extended losses below it. Friday's session delivered the decisive blow: despite a softer-than-expected Nonfarm Payrolls print, gold failed at $4,200 as US yields climbed.
The weekly candle structure is bearish — a long upper wick above $4,300 with the body settling in the lower third of the range. The high of the week sat near $4,400; the low printed in the mid-$4,100s.
Key Events That Moved Gold
Last week's NFP report missed consensus, which should have been a tailwind for gold. It wasn't. The dollar debasement narrative faded as yields surged, and the metal could not hold its gains.
Pension fund flows also shifted beneath the surface, with reports that funds are using gold as a bond hedge less aggressively than earlier in the year. That removed a structural bid that had supported the summer rally.
Finally, positioning ahead of the Fed's communications and the inflation test kept speculative money cautious. Traders trimmed longs into the weekend rather than chase a breakout that never came.
Weekly Close Analysis
At $4,141.80, gold closed below its 50-period moving average at $4,142.91 but essentially at its 20-period average of $4,141.80. That is a coin-flip close — neither bulls nor bears can claim control.
The close is below the $4,195.80 first resistance (R1), confirming that the $4,200 zone has flipped from support to supply. It remains comfortably above the $4,113 daily pivot downside target, which is the line in the sand for the bullish structure.
Next Week Economic Calendar & Gold Impact
The calendar is moderately loaded, with inflation data and Fed communication the two swing factors. ForexFactory data was unavailable at publication time, so the schedule below reflects the standard October release cadence.
| Day | Event | Forecast | Previous | Gold Impact |
|---|---|---|---|---|
| Mon Oct 05 | ISM Services PMI | 52.1 | 51.8 | Beat = bearish gold; miss = bullish |
| Tue Oct 06 | JOLTS Job Openings | 7.15M | 7.21M | Weak = dovish = bullish |
| Wed Oct 07 | FOMC Minutes | — | — | Hawkish tone = bearish |
| Thu Oct 08 | CPI (YoY) | 2.9% | 3.1% | Hot = bearish; cool = bullish |
| Fri Oct 09 | PPI (MoM) | 0.2% | 0.3% | Soft = bullish |
The CPI release on Thursday is the week's pivot point. A print at or below 2.9% would validate the disinflation trend, pull yields lower, and give gold the fuel to retest $4,195.80.
A hotter-than-expected CPI above 3.1% would reinforce the higher-for-longer narrative, push real yields up, and likely send XAU/USD toward the $4,113 daily downside target.
Wednesday's FOMC minutes carry secondary importance. Traders will scan for any language shift on the pace of cuts. A hawkish tone is a headwind for gold; a dovish tilt opens the door to the $4,225.60 second resistance.
Technical Analysis
The technical picture is balanced with a slight bearish lean. Price sits at the 20-period average but beneath the 50-period, and momentum is neutral — a setup that favors range trading until a catalyst breaks the stalemate.
Moving Average Structure
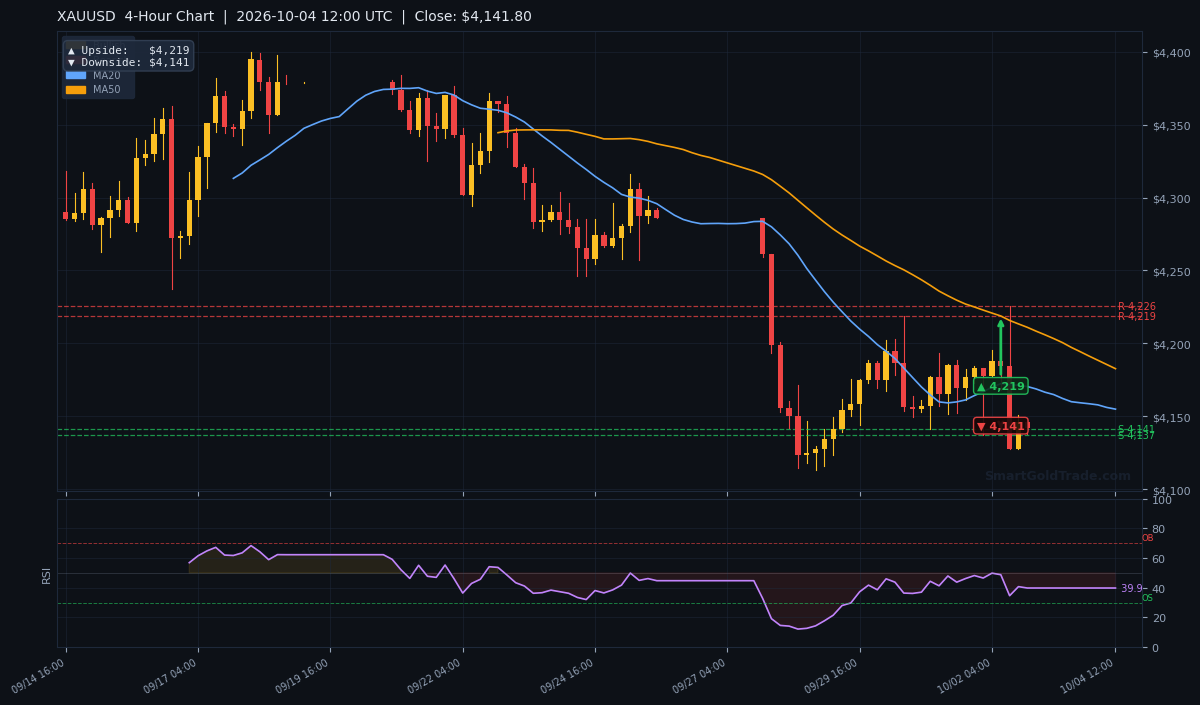
On the H4 chart, the 20-period moving average sits at $4,141.80 — exactly at the current price. The 50-period average at $4,142.91 sits marginally above, creating a bearish crossover configuration.
When MA20 is below MA50, short-term momentum is weaker than the intermediate trend. The gap is tiny — barely $1 — so the bearish signal is weak, not decisive. A close above $4,143 would neutralize it.
RSI and Momentum
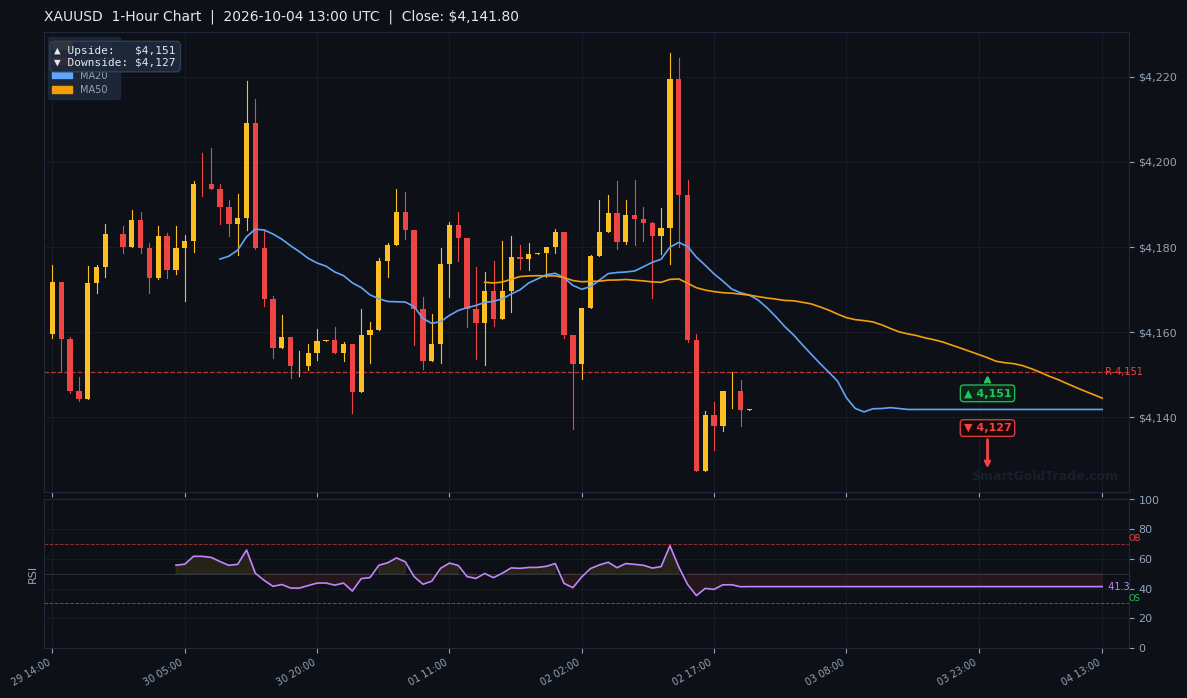
The RSI(14) reads 41.3, squarely in neutral territory. There is no oversold condition to fuel a bounce, and no overbought reading to warn of a reversal.
This is a market waiting for direction. RSI between 40 and 50 typically precedes either a base-building phase or a fresh leg lower. Watch for a break above 50 to confirm bullish intent, or below 35 to signal accelerating selling.
Key Support and Resistance Levels
The levels below define the battlefield for the week. Trade reactions at these zones, not predictions.
- Resistance 2 (R2): $4,225.60 — major cap, confluence with prior supply
- Resistance 1 (R1): $4,195.80 — first hurdle, prior support turned resistance
- Current Price: $4,141.80 — sits at MA20
- Daily Downside Target: $4,113 — critical structural support
- H4 Upside Target: $4,219 — aligns with R2 zone
- H4 Downside Target: $4,141 — current pivot
- H1 Upside Target: $4,151 — immediate intraday ceiling
- H1 Downside Target: $4,127 — immediate intraday floor
- Weekly Upside Target: $4,632 — breakout extension if $4,226 clears
Based on the ATR-implied range and the spread between the daily targets, the expected weekly trading band spans roughly $4,113 to $4,226. A breakout beyond either edge would open the door to the $4,632 extension or a deeper retracement.
Trading Scenarios This Week
Three paths are plausible. Each carries a probability weighting based on the current technical and macro setup.
Bullish Scenario (probability 40%)
Trigger: A daily close above $4,151 (H1 upside target) followed by a break of $4,195.80. A soft CPI print would accelerate this path.
- Entry zone: $4,145–$4,155 on retest
- Target 1: $4,219 (H4 upside target)
- Target 2: $4,225.60 (R2)
- Stop loss: $4,125 (below H1 downside target)
Bearish Scenario (probability 45%)
Trigger: A daily close below $4,141 that holds, with RSI pushing under 35. A hot CPI print above 3.1% would catalyze this move.
- Entry zone: $4,135–$4,140 on failed retest
- Target 1: $4,127 (H1 downside target)
- Target 2: $4,113 (daily downside target)
- Stop loss: $4,158 (above H1 resistance)
Neutral / Range-Bound Scenario (probability 15%)
If no catalyst forces a break, expect mean reversion between $4,127 and $4,195.80. Fade extremes: buy near $4,130, sell near $4,190, with tight stops outside the range.
Risk Factors to Watch
A surprise geopolitical escalation — particularly in the Middle East or involving major central bank intervention — could override the technical setup and send gold sharply higher through $4,226. Conversely, a hawkish Fed surprise or a stronger-than-expected dollar rally would invalidate the bullish case.
The key invalidation level is $4,113. A sustained break below it flips the weekly bias decisively bearish and targets the mid-$4,000s. A close above $4,226 flips it bullish and opens the $4,632 extension. Watch the dollar index and 10-year real yields for early warning signals.
Key Takeaways
- Gold trades at $4,141.80, pinned between MA20 ($4,141.80) and MA50 ($4,142.91) — a bearish but marginal setup.
- RSI at 41.3 is neutral; no oversold bounce is imminent, no overbought reversal is due.
- Immediate resistance sits at $4,195.80 (R1) and $4,225.60 (R2); support at $4,113 is the structural line in the sand.
- Thursday's CPI print is the week's pivotal catalyst — a cool reading targets $4,219, a hot reading targets $4,113.
- Weekly range projection: $4,113–$4,226; breakout above $4,226 opens $4,632.
- Bias is neutral-to-bearish until price reclaims $4,151 on a closing basis.
Conclusion
The weekly bias is neutral with a bearish lean. Gold enters the October 04–10 window below its 50-period average, capped by $4,195.80 resistance, and lacking a momentum catalyst in either direction.
The single most important level is $4,113. Hold it, and the market grinds sideways with upside potential toward $4,219. Lose it on a daily close, and the door opens to a deeper correction.
For traders who prefer to follow institutional-grade setups rather than construct their own, professional gold trading signals can provide real-time entry, stop-loss and take-profit levels during the CPI release and FOMC minutes. For those building long-term wealth in gold outside of leveraged trading, Shariah-compliant gold investment pools offer a halal route to participate in gold's upside without interest or speculation.
FAQ
What is the gold price forecast next week?
I expect gold to trade between $4,113 and $4,226 next week. The bias is neutral-to-bearish unless price reclaims $4,151 on a daily close, which would open the door to $4,219.
What is the most important level to watch?
$4,113 is the structural line in the sand. A sustained break below it flips the weekly bias decisively bearish and targets the mid-$4,000s.
How will Thursday's CPI report affect gold?
A CPI print at or below 2.9% would be bullish for gold, potentially pushing XAU/USD toward $4,195.80. A hotter reading above 3.1% would likely send gold toward $4,113.
Risk Disclaimer: Trading gold and other leveraged instruments carries a high level of risk and may not be suitable for all investors. Past performance is not indicative of future results. The analysis above is for educational purposes only and does not constitute investment advice. Always conduct your own research and consult a qualified financial advisor before making any trading decisions.
Trading Gold (XAU/USD) carries significant risk of loss and is not suitable for all investors. This content is for informational purposes only and does not constitute financial advice. Always conduct your own research and trade responsibly.