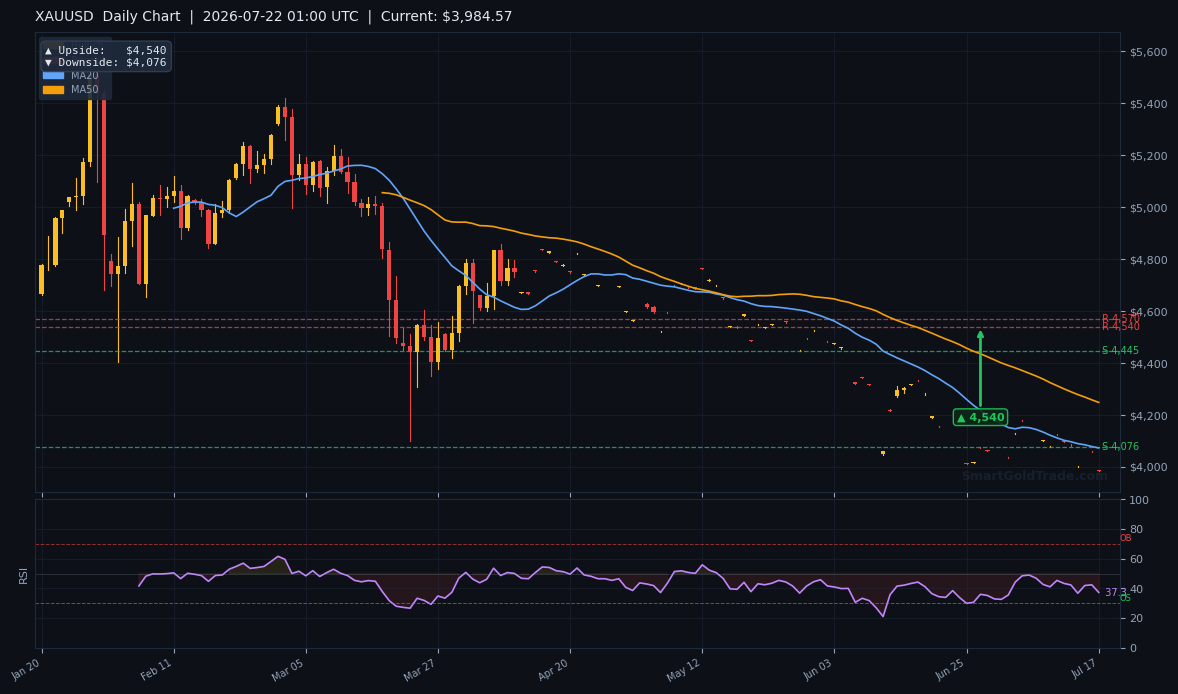
Update: As of 02:30 UTC on 22 July 2026, gold price trades at $4,124.14 per troy ounce, recovering sharply from the early Asian session low of $4,013.47. This rebound validates the $4,063 support floor we identified earlier today. Below is our original intraday analysis—key levels remain intact for navigating the rest of the session.
Gold price stalled at $4,013.47 during early Asian hours, struggling to find footing after a week of steady declines. Last Friday's stronger-than-expected US retail sales reinforced the dollar's ascent, leaving XAUUSD pinned below its major moving averages. OCBC strategists this morning flagged that broad USD direction remains the dominant driver for Asian currencies, a dynamic that continues to pressure gold as well.
With Tokyo and Singapore traders only starting to filter in, liquidity is thin—making sudden breakouts unlikely but a slow grind lower entirely possible.
This session, the question is whether bears can drive gold price to the next support at $4,063, a level that has held twice in the past two weeks.
Gold Market Overview
Macro Context
The US Dollar Index holds above 104.50 as markets reassess the Federal Reserve's rate path. After last week's upbeat retail sales, traders scaled back expectations for a near-term cut, pushing the 10-year Treasury yield toward 4.25%. That environment keeps gold price on the back foot.
Geopolitical risks—primarily tensions in the Middle East—haven't evaporated, but haven flows are muted while real yields grind higher. OCBC strategists Sim Moh Siong and Christopher Wong noted that broad USD direction remains the key driver for Asian currencies and risk sentiment, which reinforces the negative correlation dragging gold lower.
Session Outlook
The Asian session typically sees thin order books, and today is no exception. With major hubs gradually waking up, expect a range-bound drift with a bearish tilt. Any sudden dip could be exaggerated by thin liquidity, but chasing moves in low volume is a recipe for being stopped out.
The likely intraday range is $4,000 to $4,100, with a break below $4,013 opening a path to $4,063. Traders should stay patient and let levels prove themselves before committing.
Technical Analysis
Moving Average Structure
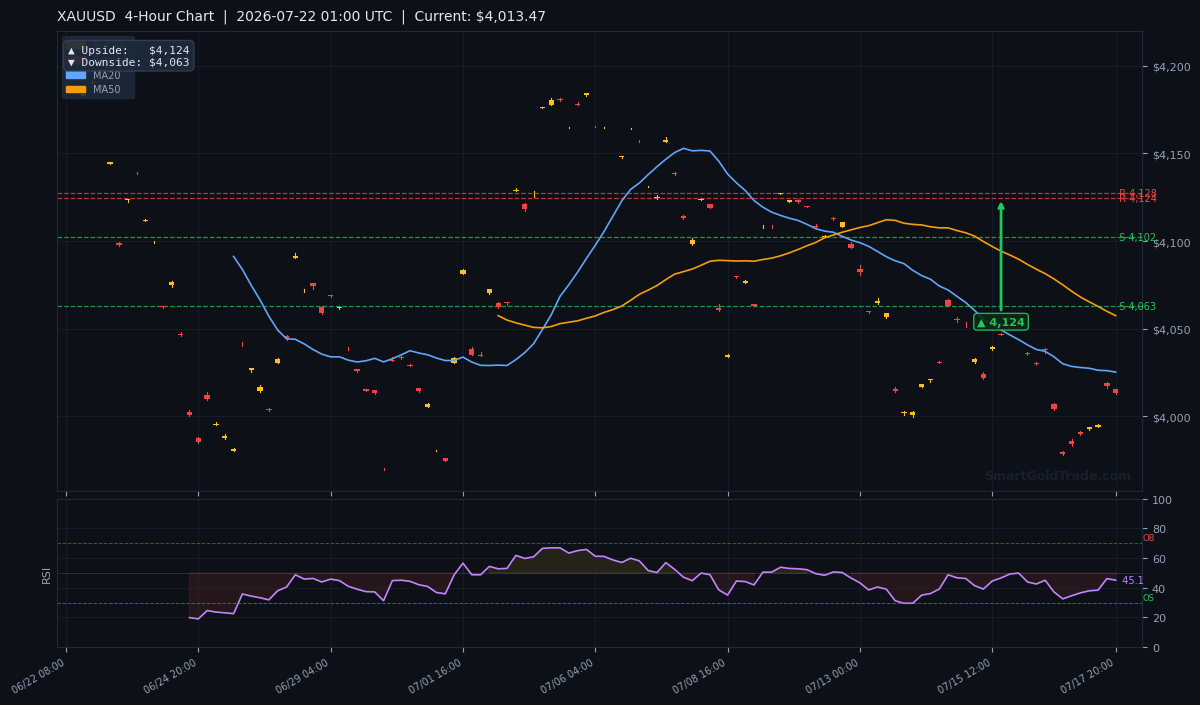
The moving averages all sit above current price, painting a clearly bearish picture. The MA20 stands at $4,025.26 and the MA50 at $4,057.47—both sloping lower after a bearish crossover last week. The MA200 at $4,159.27 looms far overhead, confirming the longer-term downtrend.
The EMA structure—MA20 below MA50—signals persistent short‑term bearish pressure. Until gold price reclaims the $4,025–$4,057 corridor, any bounces will likely be sold.
RSI and Momentum
The 14‑period RSI reads 45.1, stuck in neutral territory but angled downward. That gives bears room to run before oversold conditions appear. Momentum is clearly negative, yet not exhausted. The ATR(14) of $12.14 suggests a typical daily range of about $24—enough for meaningful moves, especially if liquidity fades further during the overlap with early European hours.
Key Price Levels
Pivot‑based support S1 at $4,147.61 and S2 at $4,124.26 have both been broken cleanly, flipping these levels to resistance. The nearest meaningful support now comes from the 4‑hour chart: a downside target at $4,063, with the daily pivot at $4,076 providing a secondary cushion.
On the upside, resistance stands at $4,159.15–$4,164.23, a wall that bulls would need to scale to shift the daily trend. The 4‑hour chart below captures this breakdown, with price firmly under the bearish cloud.
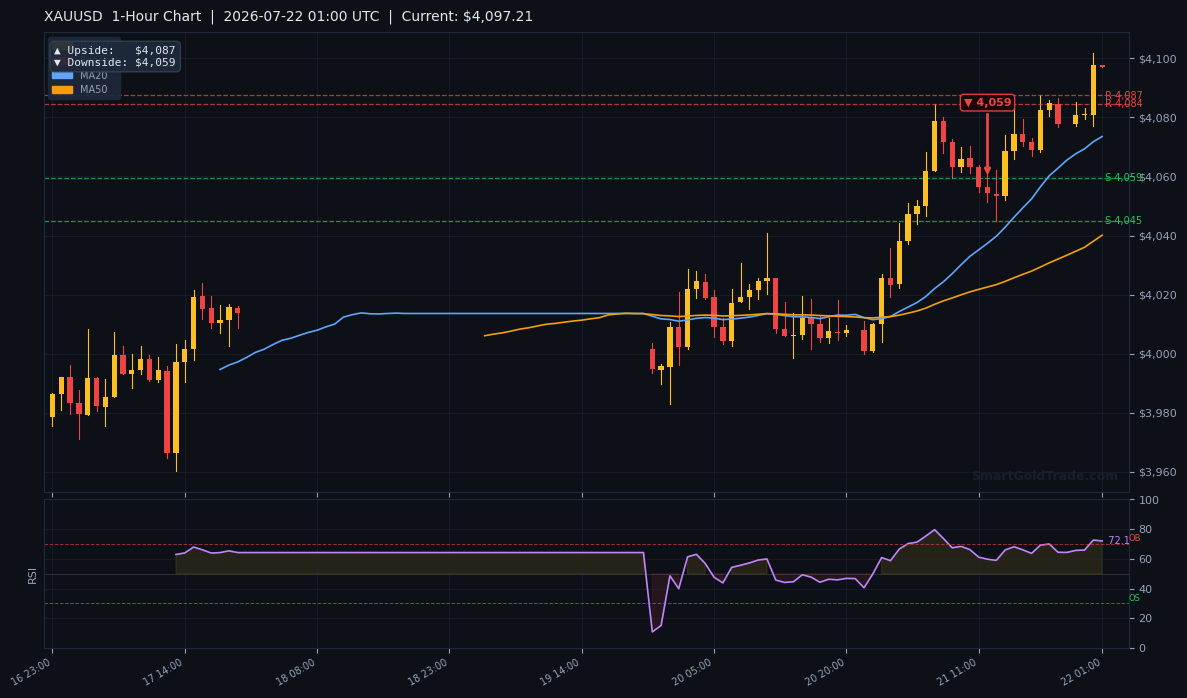
The 1‑hour chart reinforces the near‑term weakness. Price is testing the $4,013 level with a downside target at $4,059. A clean break below this hourly floor would open a straight shot to the $4,063 4‑hour support.
As we noted in our previous analysis, gold often finds a floor near $4,061 after breaking below $4,147. The 1‑hour chart shows bears in control but warns that thin Asian volume can produce false breakdowns.
Fundamental Drivers
The primary weight on gold price remains the strong US dollar, as echoed by the OCBC strategists this morning. With no tier‑one data on today's calendar, the greenback is likely to trade on carry and risk sentiment.
Overnight, light profit‑taking in equities could lend a touch of safe‑haven demand, but not enough to offset the dollar's gravitational pull. Oil prices have stabilised, reducing the inflation‑hedge bid that occasionally props up gold.
Key Event to Watch
Friday's flash PMI readings for July will be the week's highlight. If US manufacturing or services data miss expectations, markets may revive hopes for a Fed cut, weakening the dollar and giving gold a reprieve toward $4,124.
Conversely, strong PMI figures would likely accelerate the grind toward $4,063 and potentially $4,000. Until then, gold price will probably drift lower in the absence of a catalyst.
Devil's Advocate
A sudden reversal above $4,147—the now‑resistance former S1 pivot—would call the bearish bias into question. If gold price pushes through that level and closes above the $4,159–$4,164 resistance zone on a 4‑hour candle, the short‑term trend would flip to neutral, targeting $4,200.
For that to happen, the dollar would need a sharp intraday swoon, perhaps triggered by a hawkish back‑track from a Fed speaker. The odds are low in thin Asian trade, but a trader who stays prepared isn't caught off guard.
Trading Strategy for Asian Session
Given the bearish technical alignment and quiet fundamental backdrop, selling rallies remains the preferred play. Wait for a bounce into the $4,100–$4,124 resistance zone—a region where the 4‑hour upside target converges with broken support‑turned‑resistance. Place a stop loss just above $4,147 (the breached S1 pivot) at $4,150, using the ATR to give the trade room without excessive risk.
The initial take‑profit sits at $4,063, aligning with the 4‑hour downside target. A break below $4,063 would warrant trailing stops toward $4,000.
Because liquidity is thin, scale into positions slowly and avoid aggressive entry immediately after the opening bell. A price‑table summary of key levels is below.
For additional confirmation, professional gold trading signals can provide real-time alerts on gold price breakouts, helping you stay aligned with institutional flows.
| Timeframe | Entry Zone | Stop Loss | Target 1 | Target 2 |
|---|---|---|---|---|
| Short‑term (1H) | $4,100–$4,124 | $4,150 | $4,063 | $4,000 |
Key Takeaways
- Gold price begins the Asian session at $4,013, below all three major moving averages.
- RSI at 45.1 shows bearish momentum with room to fall further, while ATR of $12.14 implies a $24 daily range.
- Broken supports $4,147.61 and $4,124.26 now act as resistance; key support lies at $4,063.
- The 4‑hour chart targets $4,063 to the downside and $4,124 to the upside, framing the session's risk boundaries.
- Thin Asian liquidity warns against chasing moves; wait for a pullback into the $4,100–$4,124 zone before shorting.
- Friday's flash PMI data stands as the week's directional catalyst—strong prints could accelerate a drop to $4,000.
Conclusion
A bearish technical landscape, a firm US dollar, and low‑volume Asian conditions all point toward further downside probing. Gold price needs to hold $4,013 to avoid an immediate slide to $4,063, but the moving‑average damage suggests rallies will be capped near $4,124.
Until a powerful fundamental shift appears—likely on Friday's PMI release—the path of least resistance is lower. The smart trade isn't to force entries but to wait for price to revisit resistance, confirm rejection, and then join the trend with a tight stop above $4,147. Patience in illiquid markets preserves capital and sets up high‑probability trades.
Applying Gold Price Analysis to Halal Gold Trading
Understanding where gold price is headed is only half the battle. Executing trades in a way that aligns with Islamic finance principles is equally important. SmartGoldTrade’s halal gold trading platform offers spot gold with physical ownership, zero leverage, and no overnight swaps—so you can put these strategies to work without any riba concerns.
Whether you’re selling rallies near $4,124 or scaling into positions as price approaches support, the halal trading environment lets you participate ethically. For a longer-term approach, you might also consider holding physical gold as a store of value during volatile macro cycles.
FAQ
- What is the gold price target for the Asian session?
- The immediate downside target is $4,063, which lines up with the 4‑hour pivot and recent swing lows. If that breaks, $4,000 becomes the next psychological magnet.
- Where should I place a stop loss if I