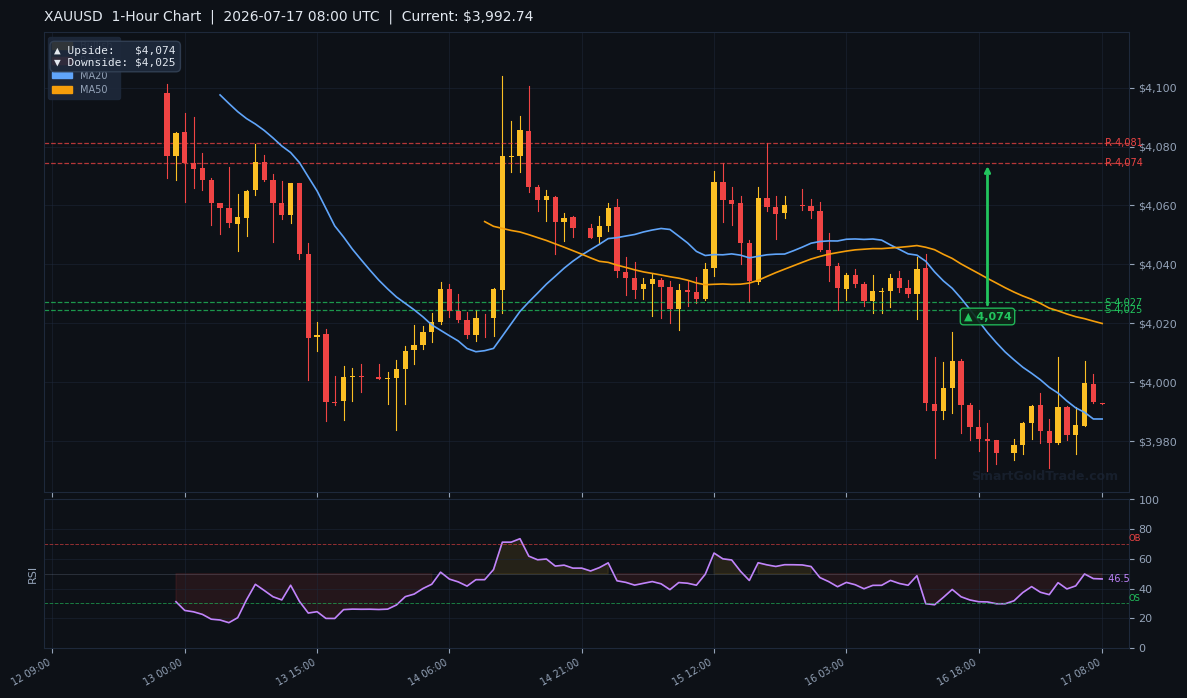
Gold price slid to $3,990.09 early Thursday, and as of 08:30 UTC it trades near $3,992.55, extending a week-long retreat that has stripped more than $130 from the metal since mid-July. Last week’s softer US inflation report briefly raised hopes of a Fed pause, yet the post-CPI bounce proved fleeting. Now, with London desks loading positions, the market faces a critical question: will $4,025 turn into a new ceiling, or can bulls reclaim $4,074 and stabilise the ship?
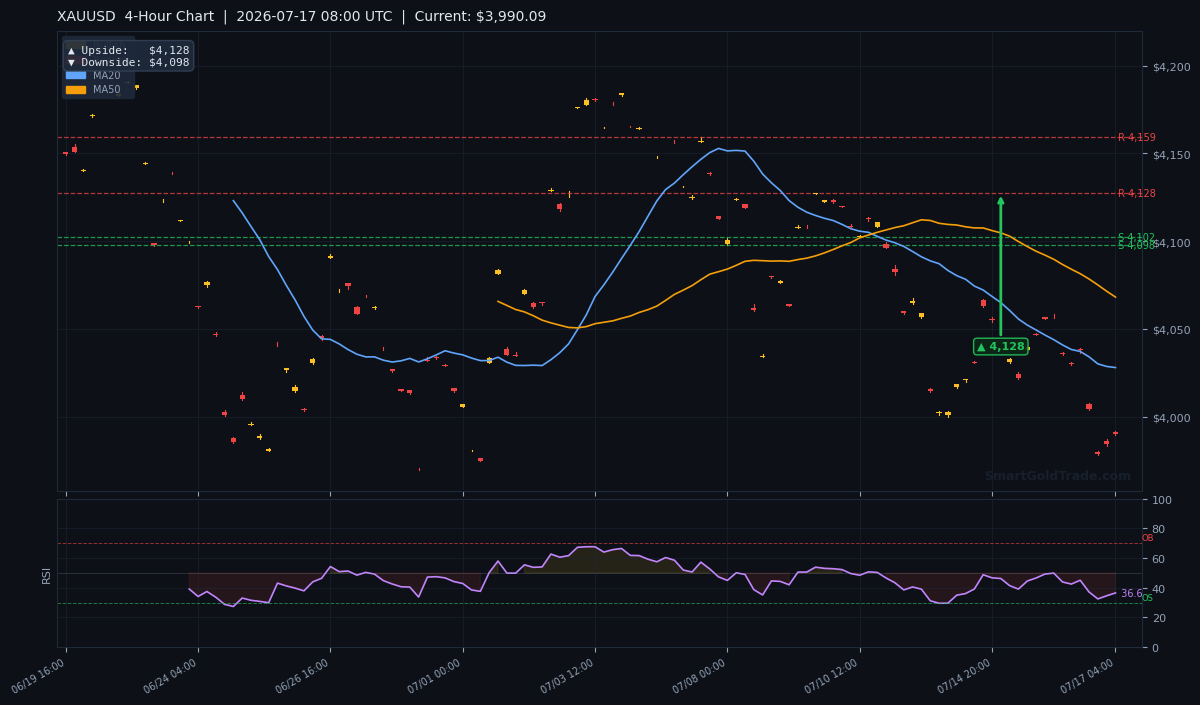
The shift in momentum is unmistakable. After touching $4,128 on 9 July, XAUUSD has systematically breached every near-term floor, dragging the 4-hour Relative Strength Index to 36.6. That reading is not yet oversold, which leaves room for another leg lower if macro headlines disappoint. Traders stepping into this European session will need to navigate fast-moving order books and a dollar that remains shaky but unbroken.
Everything now hinges on whether $4,025 — the 1-hour chart’s bearish pivot target — holds as resistance or morphs into a launchpad. This forecast outlines the technical structure, the fundamental catalysts, and a workable trading plan for the hours ahead.
Gold Market Overview
Macro Context
Dollar dynamics remain the engine behind gold’s daily swings. The DXY basket edged lower overnight after last week’s consumer price index undershot consensus, reinforcing the view that the Federal Reserve has limited room to tighten further. Two-year Treasury yields slipped back toward 4.52%, their lowest since late June, yet the gold price failed to catch a bid. That disconnect points to an underlying exhaustion among momentum buyers.
Geopolitical noise from Eastern Europe and the Middle East continues to simmer, but neither hot spot triggered safe-haven flows sufficient to offset the technical selling. Instead, traders appear to be rebalancing portfolios ahead of mid-summer FOMC minutes, which could tilt rate expectations either way. For now, the macro backdrop is supportive in theory but impotent in practice.
Session Outlook
European liquidity is returning in full force after a subdued Asian window. With London bullion desks pricing in real time, expect the intraday range to widen toward the $13.63 average true range calculated from 4-hour data. That implies a potential swing of roughly $3,976 to $4,004 if volatility remains contained, though a break either side is plausible if a fresh catalyst lands.
Three triggers could define the afternoon: a surprise German manufacturing print, any unscheduled ECB commentary, or a sharp move in EUR/USD. Should the euro strengthen and drag the dollar lower, gold may mount a relief rally toward $4,025. Conversely, a risk-on equity surge could pull institutional capital away from the yellow metal, accelerating the drop toward the $4,076 daily pivot target.
Technical Analysis
Moving Average Structure
The moving average ribbon paints an unequivocally bearish picture. Price trades below the 20-period MA at $4,027.92, the 50-period MA at $4,068.10, and the 200-period MA at $4,168.91. This descending staircase — where the MA20 sits beneath the MA50 — confirms short-term bearish pressure, while the chasm between current price and the MA200 signals that the broader trend has been damaged.
A sustained close below $4,027.92 on the 4-hour chart would keep sellers firmly in charge. Bulls need to engineer a daily reclaim of that level before anyone can seriously discuss a trend reversal. Until then, rallies are corrective within a decline.
RSI and Momentum
The 14-period RSI reads 36.6, perched inside the neutral band but with a clear downward bias. This is noteworthy because the indicator has not yet dipped into the oversold territory below 30, meaning there remains headroom for further weakness. Momentum traders often interpret a sub-40 RSI in a down-trending market as an invitation to add shorts rather than look for a bottom.
A break above 40 on the RSI would be an early sign that selling pressure is easing. For now, the indicator aligns with the moving average cross: the path of least resistance is lower, and counter-trend longs carry elevated risk.
Key Price Levels
The pivot matrix places near-term resistance at $4,184.32 (R1) and $4,164.23 (R2), though both sit far above the current gold price and are unlikely to be tested this session. Former support floors at $4,147.61 (S1) and $4,124.26 (S2) have been obliterated, turning them into potential overhead supply zones should a recovery unfold.
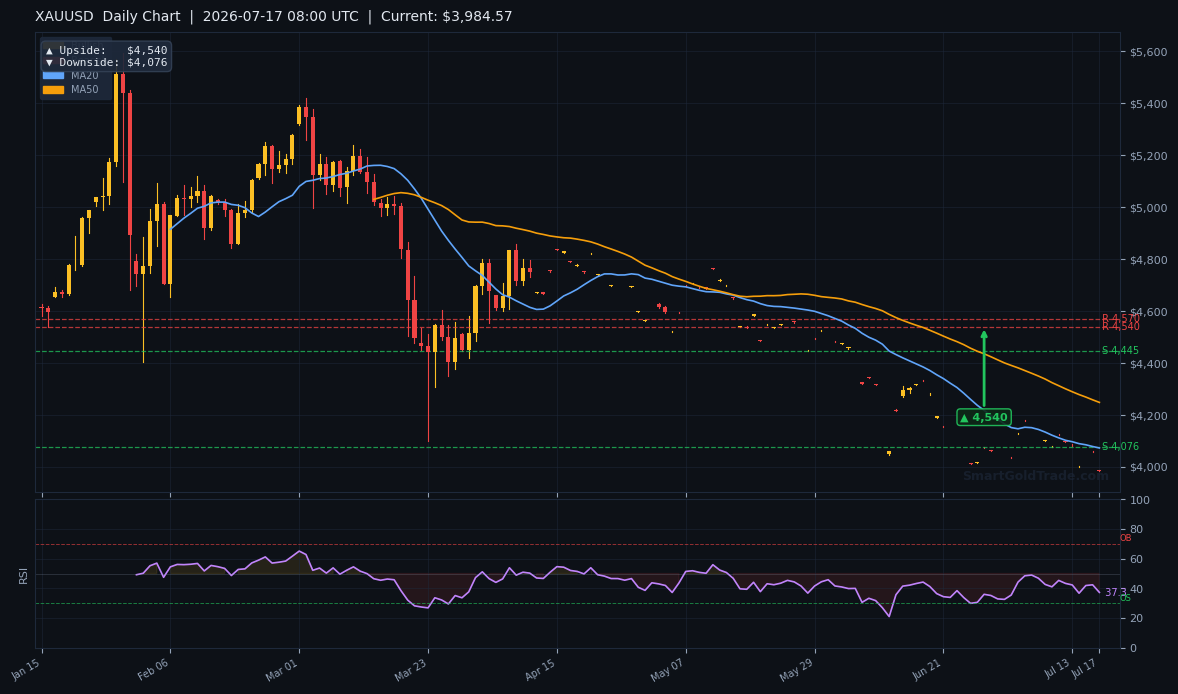
The daily chart’s downside pivot target of $4,076 aligns roughly with the 1-hour bearish objective of $4,025, creating a dense resistance cluster. On the downside, the 4-hour arrow target at $4,098 and the 1-hour bearish objective of $4,025 — now acting as a ceiling — define the immediate battle zone. A close below $3,980 would expose the psychological $3,950 handle. The ATR of $13.63 suggests that any break will likely extend $14–$16 before pausing.
| Timeframe | Upside Target | Downside Target |
|---|---|---|
| Daily | $4,540 | $4,076 |
| 4-Hour | $4,128 | $4,098 |
| 1-Hour | $4,074 | $4,025 |
Fundamental Drivers
Last week’s softer US inflation print was the headline event that should have fuelled a gold price rally, yet the metal merely flickered higher before rolling over. The reason is straightforward: the market had already priced a dovish pivot, and when the actual numbers landed, buy-the-rumour-sell-the-fact mechanics took hold. The US Dollar Index did weaken, but gold’s correlation with the greenback has been loose in recent sessions.
Federal Reserve officials have struck a measured tone, with Governor Waller emphasising that one soft CPI report does not make a trend. That has kept a floor under real yields and capped gold’s upside. Meanwhile, equity markets continue to absorb capital that might otherwise seek shelter in bullion. The net result is a gold price that is struggling to find sponsorship from either rate expectations or haven flows.
Key Event to Watch
The next major volatility trigger lands on Thursday, 19 July, when the US Census Bureau releases June retail sales figures. A strong print would revive hawkish bets and likely push the gold price toward $4,025 or lower. A disappointing number, on the other hand, could reignite recession chatter and spark a short-squeeze toward $4,074. Position sizing should account for this binary risk.
Devil’s Advocate
The bearish thesis fractures if the gold price regains $4,025 on a closing basis and then pushes through the MA20 at $4,027.92. Such a move would indicate that the recent breakdown was a false one — a bear trap — and would likely trigger stop-losses on short positions, propelling price toward the $4,074 1-hour pivot. Additionally, if the RSI bounces sharply from 36.6 and crosses above 40, momentum divergences could attract algorithmic buying. Finally, any unexpected geopolitical shock or a sudden collapse in Treasury yields would force a rapid reassessment of the directional call.
Trading Strategy for European Session
The primary bias is to sell into strength, using the $4,025 level — identified by the 1-hour chart’s downside pivot — as the reference resistance. A limit order near $4,022–$4,025 offers a favourable risk-reward ratio. Place a stop-loss at $4,074, the 1-hour upside target, because a break above that level would invalidate the immediate bearish structure. The initial take-profit target sits at $3,990, with a secondary objective at $3,980, both of which align with recent swing lows.
For traders who prefer to operate with stricter risk constraints, the $4,000 psychological level can serve as an intraday entry zone, with a stop tightened to $4,009 and a target of $3,985. This variation respects the ATR of $13.63 while keeping the stop-loss within a manageable distance.
If the gold price opens with a gap above $3,995, consider waiting for a failed retest of $4,000 before committing. Trading spot gold without overnight swaps is essential for long holding periods; SmartGoldTrade’s halal gold trading infrastructure provides that riba-free environment. For investors who prefer a hands-off approach, SmartGoldTrade's Shariah-compliant gold investment pools offer a longer-term way to gain exposure to gold's upside without active monitoring. Subscribers seeking additional conviction can also consult professional gold trading signals to verify the bias before execution.
Key Takeaways
- Gold price at $3,990.09 trades below all major moving averages, signalling bearish control.
- RSI at 36.6 leaves room for further downside before reaching oversold territory.
- Immediate resistance sits at $4,025, the 1-hour chart’s bearish pivot target turned ceiling.
- A break above $4,074 would jeopardise the bearish outlook and could spark a short-squeeze.
- ATR of $13.63 suggests a session range of roughly $3,976–$4,004 under normal volatility.
- Thursday’s US retail sales data will likely dictate the directional breakout for the week’s close.
Conclusion
The gold price enters the European session on shaky ground. The combination of a broken moving-average structure, a sub-40 RSI, and a clean series of lower highs keeps the tactical bias firmly to the downside. As long as $4,025 caps any intraday bounce, sellers have a clear path to retest $3,980 and potentially $3,950 before the week is out.
A daily close above $4,074 remains the line in the sand for bulls, but the probability of that scenario is low barring a dovish surprise from the Fed or a sudden dollar rout.
FAQ
1. What drives the gold price on a daily basis?
The gold price reacts to US dollar strength, Treasury yields, inflation data, and geopolitical events. In the short term, order flow from London bullion desks and Federal Reserve commentary often set the intraday direction.
2. Can I trade gold in a Shariah-compliant way?
Yes. Platforms like SmartGoldTrade offer riba-free spot gold trading with physical ownership and no overnight swaps. For longer-term exposure, you can also explore Islamic profit-sharing investment pools that avoid interest entirely.
3. What is the key resistance level for gold today?
Based on our analysis, $4,025 is the immediate resistance on the 1-hour chart. A break above that could challenge $4,074, but the bearish bias remains unless the gold price closes above $4,027.92 on the 4-hour chart.