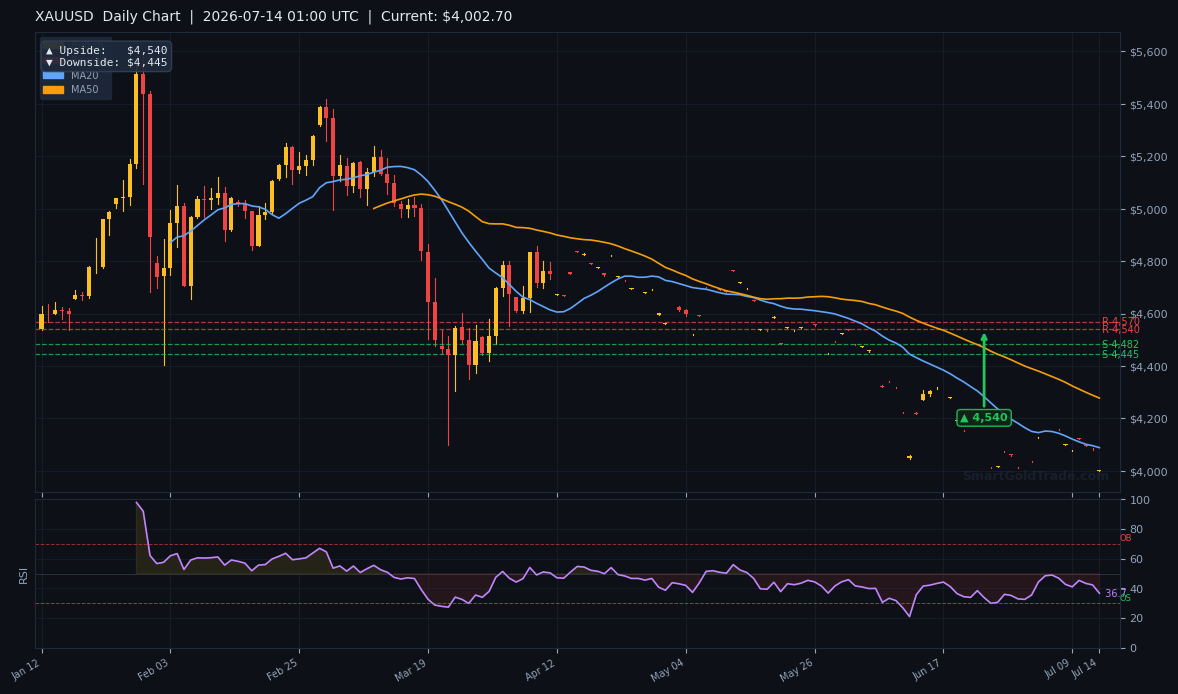
Gold price opens the Asian session at $4,002.70, hovering just above the psychological $4,000 mark after a relentless sell-off. With gold price $4,002 barely holding, yesterday's modest support in GBP/USD near 1.3370 pointed to fleeting dollar weakness, but gold failed to capitalize, underscoring how firmly the bearish winds are blowing.
This morning's calm liquidity demands patience; thin order books can turn small moves into exaggerated swings that trap the unwary. Instead of chasing price, traders should focus on the deeply oversold reading and the technical levels that could define today's range. We'll examine the landscape, the oversold RSI signal, and the only setup worth considering in a session where discipline pays more than speed.
Gold Price $4,002 Market Overview
Macro Context
The US Dollar Index has eased slightly from last week's highs, offering a modest tailwind that gold has not yet exploited. The gold price $4,002 zone has become a psychological magnet, drawing in bargain hunters even as the broader trend punishes early buyers.
The main driver remains the Federal Reserve's hawkish posture, reinforced by Fed Chair Warsh's testimony on Monday that stressed persistent inflation risks. That kept Treasury yields elevated and non-yielding assets under pressure.
Overnight, the GBP/USD pair found a floor near 1.3370, hinting that dollar buying is not aggressive, yet gold's inability to rally shows it is still weighed by rate expectations. With the US CPI report due later this week, the macro backdrop will likely keep bulls sidelined until a fresh catalyst emerges.
At the time of writing, spot gold has already climbed to $4,017.97, confirming that the oversold bounce is materializing. This intraday recovery shows sellers are losing momentum near the $4,000 round figure, though the dominant downtrend remains intact.
Session Outlook
Asian hours typically bring thin liquidity, and with Tokyo off for a holiday, volumes will be even thinner today. That amplifies the risk of false breakouts and whipsaws. The most probable scenario is a sideways grind between $3,995 and $4,025, with any push toward extremes likely to be faded. Traders should resist the urge to jump on the first 10-dollar spike; conviction moves rarely materialize before London opens. Absent a geopolitical headline, gold is unlikely to trend during this window—range-bound scalping is the pragmatic play.
Technical Analysis
Moving Average Structure
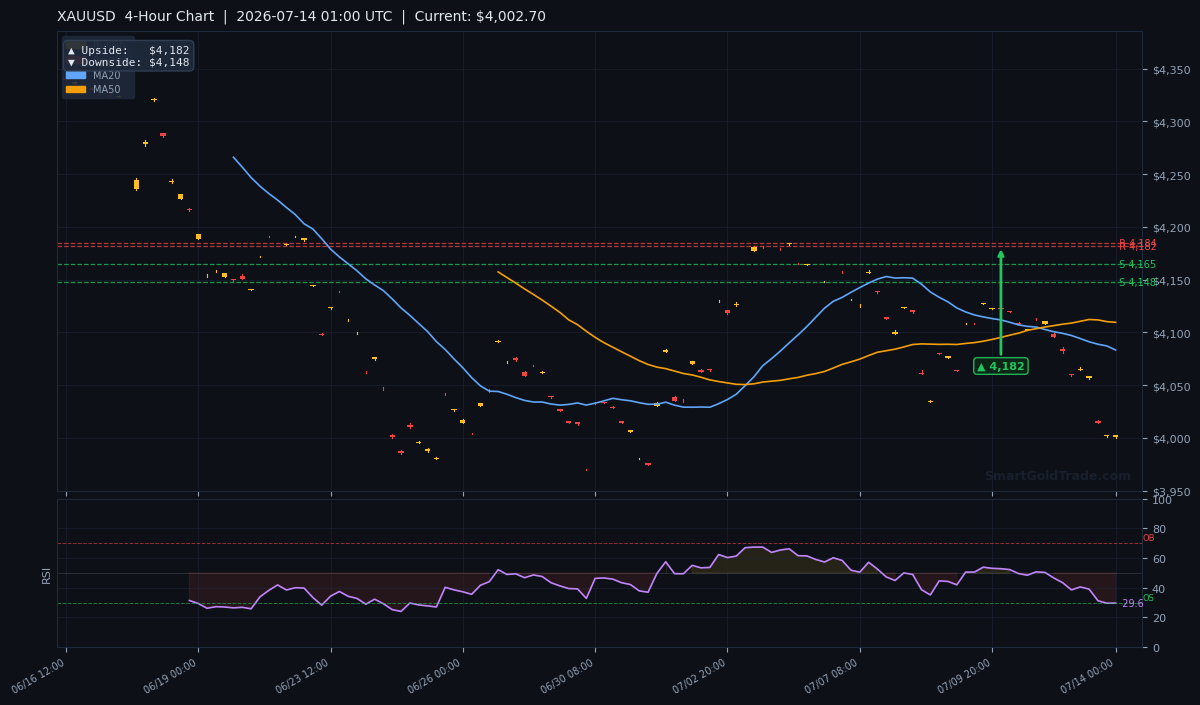
The 4-hour chart reveals a pronounced bearish structure. The short-term MA20 sits at $4,083.30 and the medium-term MA50 at $4,109.54, both sloping lower. The long-term MA200 stands far above at $4,214.87, confirming a deep bearish trend. Crucially, price trades below all three, and the MA20 remains below the MA50 — a classic bearish alignment. Any bounce will immediately face selling pressure at these dynamic resistance zones, limiting upside potential in the near term.
RSI and Momentum
The 14-period RSI reads 29.6, deeply oversold territory. In normal conditions, this level triggers mean-reversion bounces that can extend to $4,047 or $4,073. However, oversold readings can persist during strong downtrends, and the Asian session's thin liquidity often produces short-lived pops rather than sustained reversals. The RSI signal is a caution light for bears, not a green light for aggressive longs—it tells us that chasing is riskier on both sides.
Key Price Levels
Support levels derived from prior structure include S1 at $4,164.51 and S2 at $4,147.61, but both now lie far above price, having been broken decisively. They now act as overhead resistance. Formal resistance stands at R1 $4,184.32 and R2 $4,181.55, a tight cluster that forms a formidable ceiling.
The ATR(14) of $12.21 suggests an expected daily range of roughly $24, which could easily test $3,978 on the downside or $4,026 on the upside before the session ends. The 4-hour chart below captures the moving average cascade and the recent breakdown below the $4,147 zone.
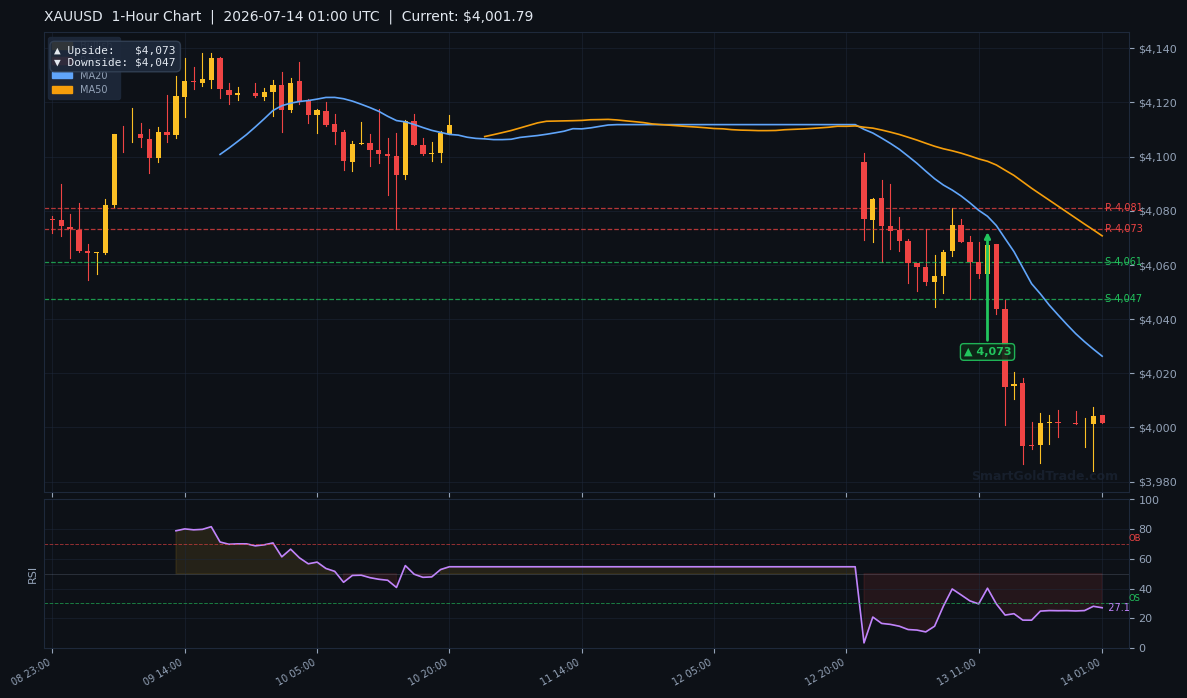
A closer look at the 1-hour timeframe shows price consolidating near $4,000, with the initial upside target at $4,073 and support at $4,047.
Fundamental Drivers
This week's single most important event is the US CPI release, expected on Wednesday or Thursday. A hotter print would reinforce the bearish gold narrative and could send price crashing through the $3,980 floor. A cooler reading, on the other hand, would trigger a sharp short-covering rally that might reach the $4,073–$4,147 zone.
Monday's testimony by Fed Chair Warsh already underscored a hawkish stance, keeping Treasury yields buoyant. The modest dollar retreat seen in cable's 1.3370 support shows cracks in dollar aggression, but gold needs more than a paused dollar to stage a meaningful recovery—it needs a dovish data surprise.
Key Event to Watch
The US CPI report is the decisive catalyst. A number above consensus would lock in the bearish case, while a miss could finally lift gold off the canvas. Until that data lands, gold will likely struggle to sustain any move above the $4,083 MA20.
Devil's Advocate
If gold manages to recover and close a 4-hour candle above $4,147, the broken support-turned-resistance, the bearish thesis would weaken significantly. A sharp rally driven by a safe-haven bid from an unexpected geopolitical shock could also propel price toward the $4,184 resistance cluster. However, given the heavy technical damage and the oversold RSI showing no divergence, a sustained move above $4,100 appears unlikely without a meaningful fundamental catalyst. The burden of proof sits squarely on bulls.
Trading Strategy for Asian Session
For long-side setups, a bounce from the $4,000 psychological level could offer a scalping opportunity. The entry zone is $3,998–$4,005, with a stop-loss at $3,988—just below half the ATR and beneath the recent swing low. Take profit at $4,047 (the 1-hour pivot target) and an extended target at $4,073.
This is a counter-trend trade in thin liquidity—risk only a fraction of normal position size. Conservative traders should wait for a confirmed break above $4,020 before committing. Shorting into the abyss is also risky given the oversold RSI; a better short entry would be a retest of the $4,083 MA20 on a failed rally.
When trading these conditions, using a halal gold trading platform that offers interest-free spot gold ownership eliminates overnight funding charges, a crucial advantage for positions that might be held across sessions. If you prefer a more tangible approach, you can purchase physical gold coins and bars to hold outside the trading account. For additional confirmation on entry timing, many traders supplement their analysis with professional gold trading signals that identify high-probability setups.
Key Takeaways
- Gold price sits at $4,002.70, below all key moving averages, signaling a sustained bearish trend.
- RSI at 29.6 indicates oversold conditions, often a precursor to short-term bounces, especially in Asian trade.
- The nearest target for a potential rebound is $4,047 (1-hour pivot), while major resistance now stands at $4,147–$4,184.
- Asian session liquidity is razor-thin; avoid chasing breakouts and favour range-bound scalping strategies.
- A daily close below $4,000 would open the door to further declines, with the next psychological floor at $3,980.
- This week's US CPI release is the make-or-break event; a hotter print could send gold below $3,950.
Conclusion
Gold's struggle below $4,000 is real, but the oversold RSI warns against aggressive selling at current levels. The Asian session is likely to see consolidation between $3,995 and $4,025, with a mild upward bias if the dollar remains subdued. The key level to watch is $4,147—until price reclaims that, the downtrend remains intact. I maintain a patient stance, ready to act only when price confirms a directional move. The real test comes later this week with the US inflation data.
FAQ
What does the RSI reading of 29.6 mean for gold price?
An RSI below 30 signals oversold conditions, suggesting that selling momentum may be exhausted. In previous instances, such readings within the Asian session often lead to temporary bounces toward the $4,047–$4,073 zone, but the prevailing bearish trend can override this signal.
Is gold expected to break below $4,000?
A break below $4,000 is possible given the bearish moving average structure. The ATR of $12.21 implies a daily low could test $3,978, but the psychological $4,000 level may attract buyers initially. The daily chart pivot downside is $4,445, suggesting that if the trend intensifies, significant support remains far below.
What are the best trade setups for gold this Asian session?
A counter-trend long from the $3,998–$4,005 area with a stop at $3,988 and target $4,047 is one approach. However, due to thin liquidity, a more prudent strategy is to wait for a break above $4,020 before entering long. Shorts could be considered on a failed rally at the $4,083 MA20.
Risk Disclaimer: Trading Gold (XAU/USD) carries significant risk of loss and is not suitable for all investors. This content is for informational purposes only and does not constitute financial advice. Always conduct your own research and trade responsibly.