The gold price has broken below $3,789.12 in the European session, testing a critical support zone that has held since September 2025. This move follows yesterday's release of US Retail Sales data, which showed a moderate 0.2% increase in October, reinforcing the case for further Federal Reserve tightening. The dollar holds near a 19-month high, and Treasury yields remain elevated above 5%, creating a formidable headwind for the non-yielding metal. As London traders take the helm, all eyes are on the $3,780.29 level — a break below could accelerate selling pressure toward the $3,780.29 downside target. The session promises heightened volatility as markets await the FOMC Meeting Minutes later today.
Gold Market Overview
Macro Context
The US Dollar Index (DXY) hovers near 122.7, its highest level in over 18 months, as hawkish Fed rhetoric and strong economic data bolster the greenback. The 10-year Treasury yield stands at 5.12%, with real yields (TIPS) at 2.92% — both rising week-over-week. This environment is historically hostile to gold, which offers no yield. Fed officials, including St. Louis President Musalem, have signaled that "several" rate hikes may be needed to tame inflation, with markets pricing a 95.7% chance of a 25-basis-point hike in December. Geopolitical tensions, including fresh US-Iran strikes, have paradoxically supported the dollar rather than gold, as investors seek safety in US assets. The news sentiment score of -0.38 reflects this hawkish tilt.
Session Outlook
The European session opens with gold under pressure, having already broken below the Asian session low of $3,780.29. Liquidity is expected to increase as London traders enter, potentially exacerbating moves. The ATR(14) of $16.92 suggests an expected hourly range of roughly $17, but volatility could expand around the FOMC Minutes release. Key triggers include any hawkish signals from the minutes and the UK CPI data released earlier today, which showed inflation at a 13-month high of 3.7%. Traders should watch the $3,780.29 support closely; a sustained break could target $3,780.29.
Technical Analysis
Moving Average Structure
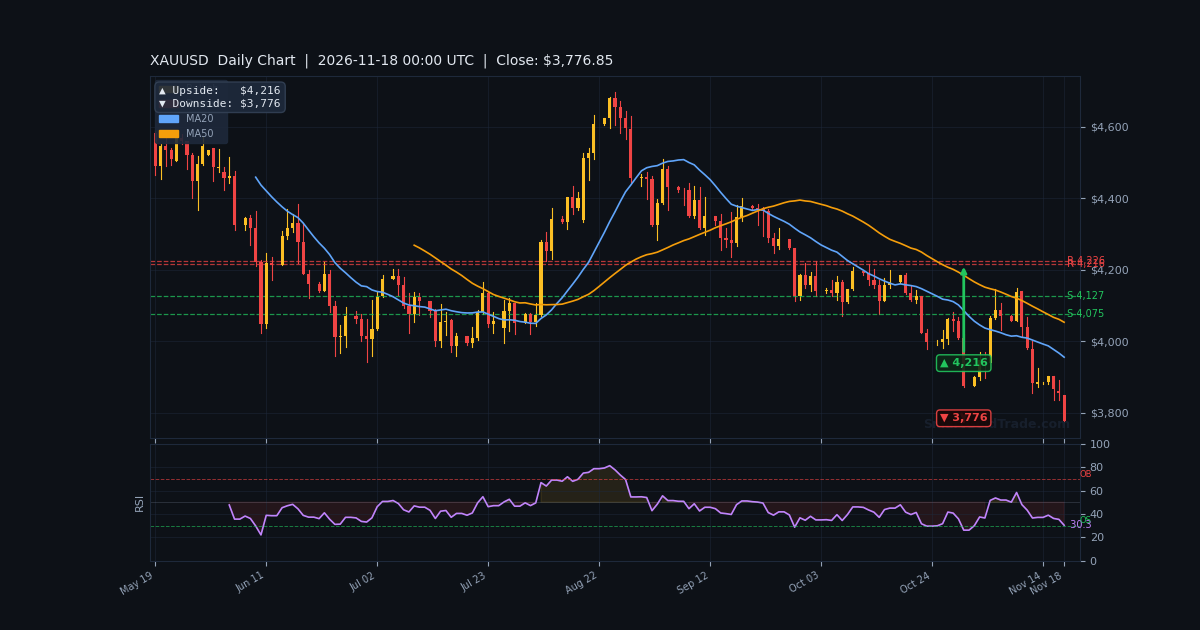
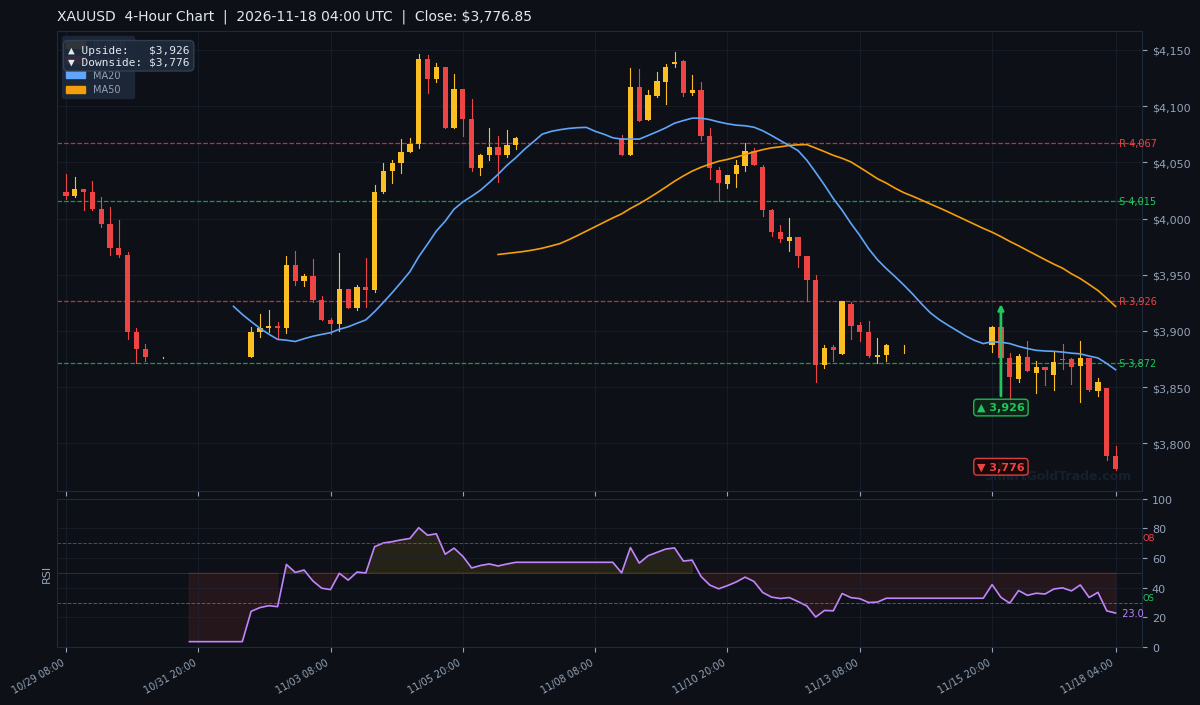
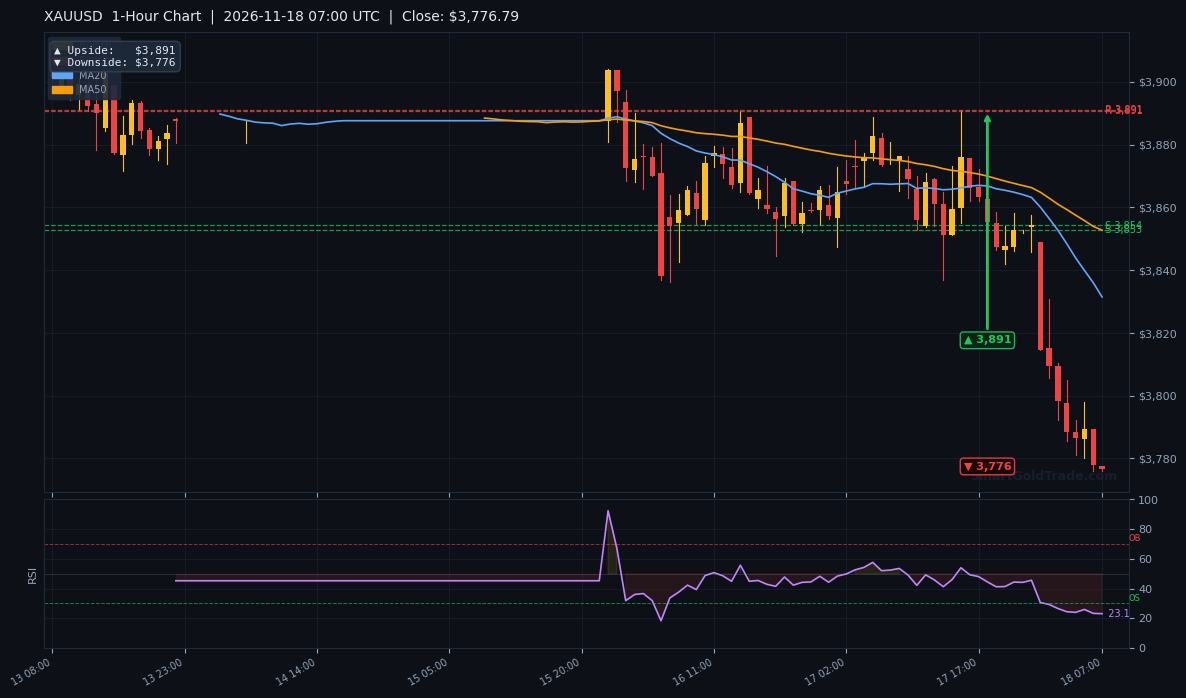
The EMA20 at $3,830.61 and EMA50 at $3,855.23 are both well above the current price, confirming a bearish trend. The EMA200 at $3,938.42 further reinforces the downtrend, with price trading below all major moving averages. On the H4 chart, the close at $3,788.76 is below the EMA50 at $3,931.42, and the D1 close is similarly below its EMA50 at $4,089.55. This alignment across timeframes signals strong bearish momentum.
RSI and Momentum
The RSI(14) on the H1 chart stands at 25.7, deep in oversold territory, suggesting a potential bounce. However, the MACD histogram is negative at -7.14, with the MACD line at -19.62 below its signal line at -12.48, confirming bearish momentum. The Stochastic oscillator is at 5.1/4.7, also oversold. While oversold conditions can trigger short-term rebounds, the prevailing trend remains down. Traders should watch for bullish divergence or a break above $3,806.74 (VWAP) to confirm any bounce.
Key Price Levels
Immediate support lies at S1 $3,780.29, which has been tested and breached in the Asian session. A break below this level opens the door to $3,780.29, the downside target from pivot arrows. Resistance is seen at R1 $3,886.69 and R2 $3,888.93, with the Bollinger Band middle at $3,839.99 and upper at $3,898.42. The expected session range based on ATR is approximately $17, but volatility may spike around the FOMC Minutes. The H4 chart shows a clear downtrend with lower highs and lower lows, while the H1 chart indicates a potential pause near oversold levels.
Fundamental Drivers
The primary driver remains the Federal Reserve's hawkish stance. Last week's hotter-than-expected inflation data and yesterday's Retail Sales report have solidified expectations for a December rate hike. The FOMC Meeting Minutes, due later today, will be scrutinized for clues on the pace of future hikes. Meanwhile, the dollar's strength, reflected in the DXY near 122.7, continues to pressure gold. Geopolitical tensions, including US-Iran strikes, have not provided the usual safe-haven bid for gold, as investors favor the dollar. ETF flows show a slight inflow of 2.6 tonnes into GLD, but this is outweighed by rising real yields. COT data shows speculators net long at 190,107 contracts, but this positioning could unwind if prices continue to fall.
Key Event to Watch
The FOMC Meeting Minutes release in approximately 12 hours is the most critical event. Any indication that the Fed is considering a faster pace of tightening could send gold below $3,780.29 toward $3,780.29. Conversely, a less hawkish tone might trigger a relief rally toward $3,830.61.
Unified Technical & Fundamental Outlook
Both technical and fundamental pillars are bearish, with a combined score of -0.62 and aligned bearish alignment. The technical score of -0.92 reflects the strong downtrend across timeframes, while the fundamental score of -0.33 captures the headwinds from rising yields and dollar strength. The only supportive factor is the GLD inflow, but it is insufficient to offset the broader bearish sentiment. This confluence suggests that the path of least resistance remains lower, though oversold conditions may cause short-term bounces. Traders should not interpret the oversold RSI as a bullish signal without confirmation.
Devil's Advocate
What could invalidate the bearish bias? A surprising dovish signal from the FOMC Minutes could spark a short-covering rally. Also, the oversold RSI and the proximity to strong support at $3,780.29 might attract bargain hunters. A break back above $3,806.74 (VWAP) would indicate a shift in intraday sentiment, while a close above $3,830.61 (EMA20) would challenge the bearish trend. Additionally, any escalation in geopolitical tensions that triggers a flight to safety could benefit gold. However, given the current macro backdrop, these scenarios are less likely.
Trading Strategy for European Session
Given the bearish bias, a conservative approach is to sell rallies. An entry zone near $3,797.89–$3,806.74 (VWAP and previous support-turned-resistance) offers a favorable risk-reward. Place a stop loss above $3,830.61 (EMA20) to protect against a bounce. Take profit targets at $3,780.29 and $3,780.29. Alternatively, if price breaks below $3,780.29 with volume, a momentum short could target $3,780.29 with a stop at $3,789.12. For those looking to buy, wait for a confirmed bounce above $3,806.74 with targets at $3,830.61 and $3,855.23. Always use proper risk management, as volatility may increase around the FOMC Minutes. Consider using a news event trading protection tool to safeguard positions during high-impact releases.
Key Takeaways
- Gold price broke below $3,789.12, testing critical support at $3,780.29.
- RSI at 25.7 is oversold, but bearish momentum persists with MACD negative.
- Immediate resistance at $3,806.74 (VWAP) and $3,830.61 (EMA20).
- Downside targets: $3,780.29; upside potential limited to $3,830.61.
- FOMC Minutes later today could trigger volatility; hawkish tone likely to pressure gold.
- DXY near 122.7 and 10-year yield at 5.12% remain major headwinds.
Conclusion
The gold price remains under pressure, with both technical and fundamental factors aligned bearishly. The break below $3,789.12 has opened the door to $3,780.29, and the oversold RSI suggests only a temporary reprieve. Traders should watch the $3,780.29 level closely; a sustained break could accelerate losses. The FOMC Minutes later today will be pivotal. For those looking to hedge or invest in physical gold, consider exploring certified gold coins and bars as a long-term store of value. As always, trade with discipline and manage risk.
Frequently Asked Questions
- What is the current gold price?
- As of the European session on November 18, 2026, the gold price is $3,789.12 per ounce.
- Why is gold falling today?
- Gold is pressured by a strong US dollar (DXY near 122.7), rising Treasury yields (10-year at 5.12%), and hawkish Fed expectations ahead of the FOMC Minutes.
- What are the key support and resistance levels?
- Support is at $3,780.29 and $3,780.29. Resistance is at $3,806.74 (VWAP), $3,830.61 (EMA20), and $3,886.69 (R1).
- Is it a good time to buy gold?
- With RSI oversold at 25.7, a short-term bounce is possible, but the trend remains bearish. Wait for confirmation above $3,806.74 before considering long positions. For long-term investors, physical gold at these levels may be attractive.
Trading Gold (XAU/USD) carries significant risk of loss and is not suitable for all investors. This content is for informational purposes only and does not constitute financial advice. Always conduct your own research and trade responsibly.