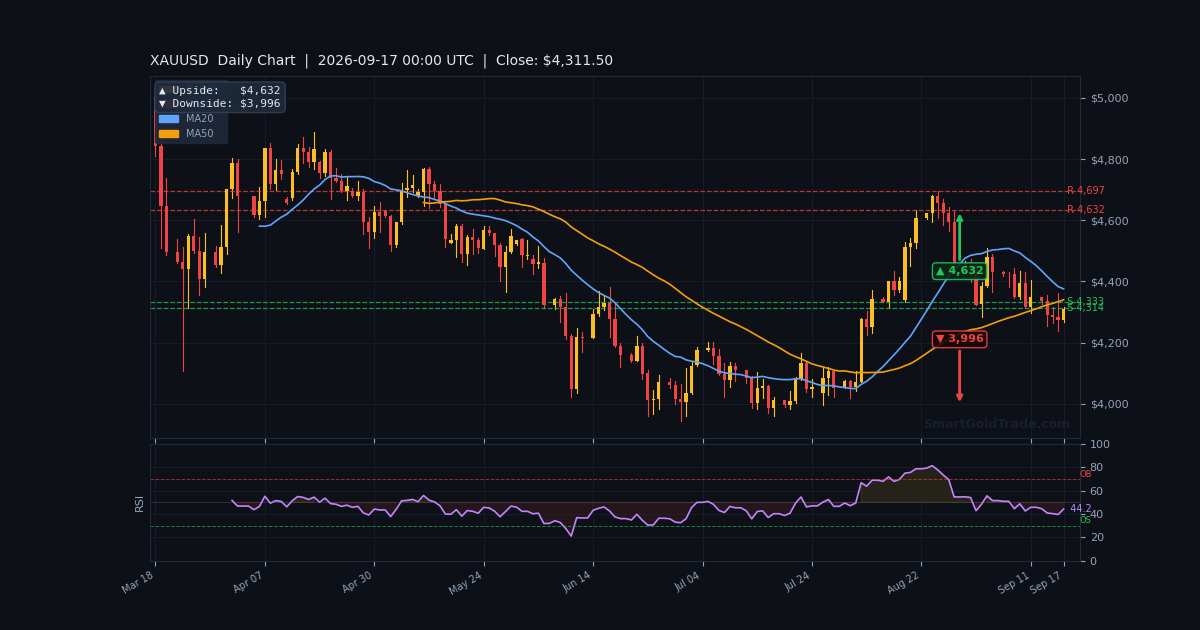
The gold price is sitting on a knife's edge at $4,304.53, and the $4,301.10 EMA20 is the only thing standing between the market and a fresh leg lower. This is no ordinary support test — it comes less than 24 hours after the Federal Reserve delivered its first rate hike since July 2023, a move that sent bullion to six-week lows near $4,235.
The hawkish tone from Fed Chair Kevin Warsh has repriced the entire precious metals complex. With the 10-year Treasury yield back near 5% and the dollar pressing seven-week highs, gold's safe-haven bid is being outmuscled by real-yield gravity.
The European session is where this resolves. London liquidity is arriving with volatility already elevated, and the $4,301 zone is the trigger. Hold it, and bulls get a shot at $4,317. Lose it, and $4,277 comes into play fast.
Gold Market Overview
Macro Context
The macro backdrop has turned decisively hostile for the gold price. The Fed's quarter-point hike on Wednesday was accompanied by explicit warnings on persistent inflation and a signal that further increases are coming. Two-year Treasury yields, the most policy-sensitive tenor, rebounded to 4.717%, while the benchmark 10-year reversed an earlier decline back to 5%.
That combination — rising nominal yields plus a hawkish Fed — is the classic bear case for non-yielding assets. The Dollar Index has extended its post-Fed rally to its highest level since late July, compounding the pressure. Escalating Middle East tensions, which would normally support gold, are instead feeding inflation fears and pushing yields higher, inverting the usual safe-haven logic.
Central bank demand remains the structural offset. Official-sector buying has been the backbone of this year's rally, and that bid does not disappear on a single Fed meeting.
Session Outlook
European traders inherit a market that closed the Asian session at $4,304.53, up 1.04% on the day but still down 0.79% for the week. The daily open at $4,260.09 confirms the bounce off $4,235.17 is real, but the weekly open at $4,338.79 remains overhead resistance.
Expect a $23–25 range in the London morning, with the first hour likely to probe $4,301 before any directional commitment. The ADX reading of 21.6 tells you the market is ranging, not trending — which means fade the extremes until a level breaks with volume.
Technical Analysis
Moving Average Structure
The EMA20 sits at $4,301.10, the EMA50 at $4,307.32, and the EMA200 at $4,351.24. Price at $4,304.53 is wedged between the 20 and 50, and critically, it remains below the 200 — a bearish structural signal.
The H4 EMA200 at $4,361.37 and the D1 EMA200 at $4,319.11 reinforce the same message: the medium and higher timeframes are still in distribution mode. Until price reclaims $4,319 on a daily close, rallies are counter-trend.
RSI and Momentum
The RSI(14) is at 50.4 — dead neutral. That is unusual after a Fed event, and it tells you the market has absorbed the shock without capitulating. Stochastic at 48.5/44.2 is similarly mid-range, leaving room to move either direction.
The MACD at -6.43 with a histogram of -0.97 is the more revealing signal. Momentum is negative but flattening — the bearish impulse is losing energy, not accelerating. That favors a range-hold at support rather than a clean breakdown, unless a fresh catalyst hits.
Key Price Levels
Support: S1 $4,300.80 and S2 $4,292.11. Resistance: R1 $4,317.63 and R2 $4,317.83. The VWAP at $4,287.58 sits below price, a mildly constructive tell for intraday longs.
The ATR(14) of $23.42 (0.54% of price) defines the expected hourly range. The Bollinger band at $4,381.90 upper and $4,240.46 lower frames the wider envelope. A break of $4,301 targets the 4H pivot at $4,303 and then the 1H downside at $4,277.
| Timeframe | Upside Target | Downside Target |
|---|---|---|
| Daily | $4,632 | $3,996 |
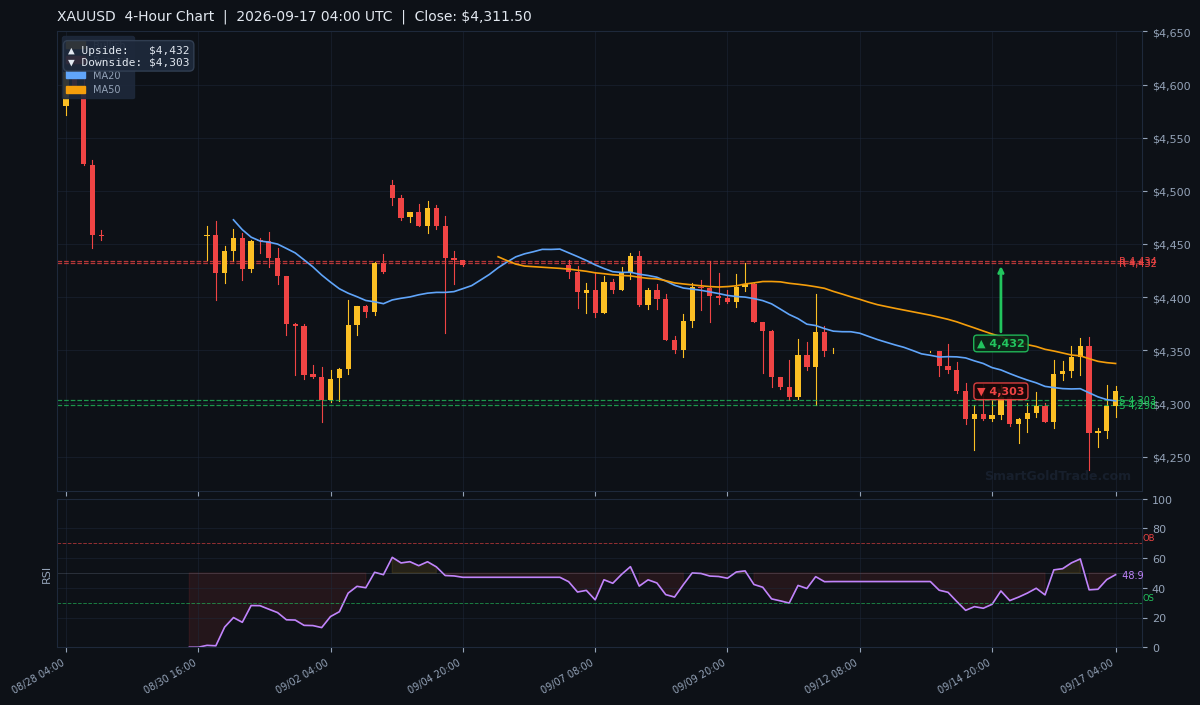
| 4-Hour | $4,432 | $4,303 |
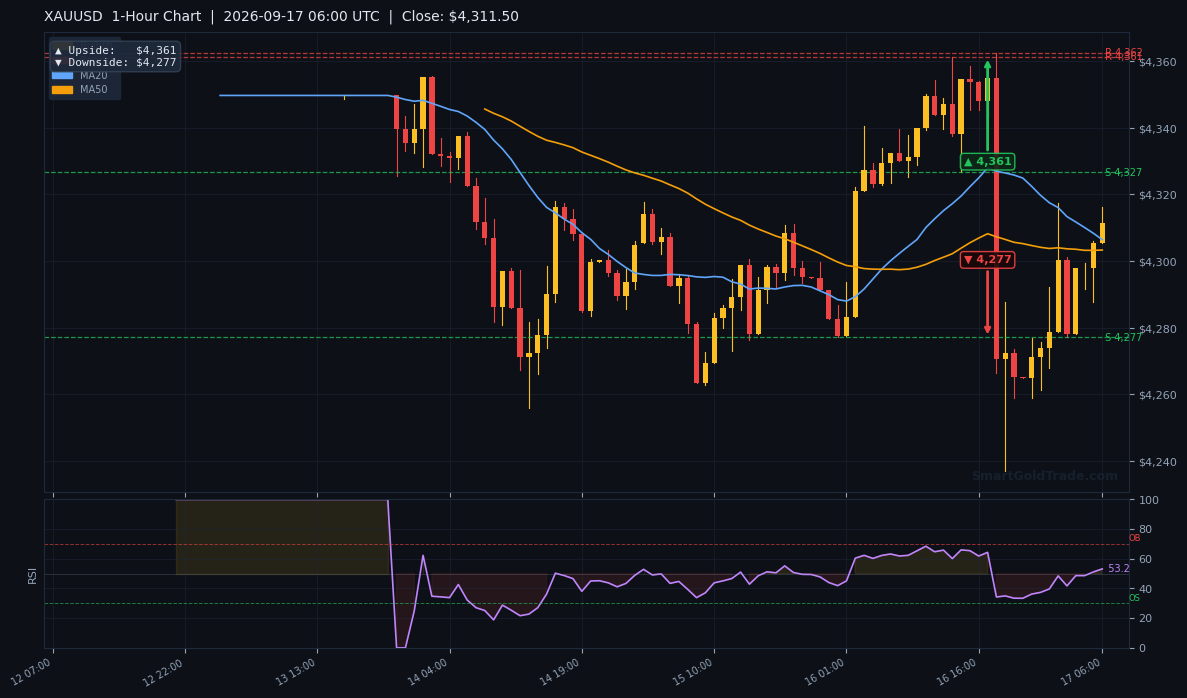
| 1-Hour | $4,361 | $4,277 |
Fundamental Drivers
The dominant driver is Wednesday's Fed decision. The quarter-point hike — the first since July 2023 — came with a press conference that leaned firmly hawkish. Chair Warsh flagged persistent inflation risks and signalled more tightening ahead. That is the single biggest headwind for the gold price right now.
The yield response was immediate. The 10-year Treasury reversed an early decline to trade back at 5%, having touched 5.041% — its highest since 2007 — in the prior session. Higher real yields raise the opportunity cost of holding bullion, and the market is repricing accordingly.
Middle East tensions are adding a second-order effect. Normally a geopolitical bid would support gold, but the inflation channel is currently dominant: conflict-driven energy risk pushes yields up, and that outweighs the safe-haven flow.
Key Event to Watch
The Bank of Japan policy decision on Friday is the next scheduled catalyst. A hawkish BoJ would strengthen the yen and could trigger broad dollar unwinding — a scenario that would give the gold price a short-term reprieve toward $4,317. Conversely, a dovish hold keeps the dollar bid and pressures $4,301 further.
Devil's Advocate
The bear case has one clear flaw: the MACD histogram is flattening at -0.97, not expanding. Breakdowns need accelerating momentum, and that is absent. The RSI at 50.4 also shows no capitulation — sellers have not taken control.
The key invalidation level is $4,317.63. A sustained hourly close above R1 would negate the bearish structure and open a run at the H4 EMA200 at $4,361.37. On the flip side, a daily close below $4,292.11 (S2 and the prior week's low) confirms the breakdown and targets $4,277.
Watch the dollar. Any DXY reversal from seven-week highs is the fastest route to a gold squeeze.
Trading Strategy for European Session
The setup is a two-way level trade around $4,301. For longs, the entry zone is $4,301–$4,304 on a hold, with a stop at $4,290 (below S2 and roughly one ATR of $23.42 below entry). First target $4,317.63 (R1), second target $4,338.79 (weekly open). Risk-reward on the first target is roughly 1:1.4; on the second, 1:3.
For shorts, wait for an hourly close below $4,300.80 (S1). Entry on the retest at $4,299–$4,302, stop at $4,313, first target $4,292.11 (S2), second target $4,277 (1H downside pivot). Do not chase the initial break — the ADX at 21.6 means false breaks are common in this regime.
Position sizing should reflect the ranging environment. Traders running automated systems may find value in a news event trading protection tool to pause exposure during unscheduled headlines, given how sensitive this market is to Fed commentary right now.
For those building longer-term exposure to bullion rather than trading the noise, physical gold products offer a way to hold the metal without the intraday leverage risk that is punishing CFD longs in this tape.
Key Takeaways
- The gold price at $4,304.53 is pinned between the EMA20 at $4,301.10 and EMA50 at $4,307.32 — a compression zone.
- Price remains below the EMA200 at $4,351.24 and the D1 EMA200 at $4,319.11, confirming a bearish higher-timeframe structure.
- RSI at 50.4 and MACD histogram at -0.97 show momentum is neutral-to-soft, not collapsing — favouring a range hold.
- Key support is $4,300.80 (S1) and $4,292.11 (S2); key resistance is $4,317.63 (R1).
- ATR of $23.42 sets the expected European session range at roughly 0.54% of price.
- The Fed's hawkish hike and 10-year yields near 5% remain the dominant headwind; the BoJ decision on Friday is the next catalyst.
Conclusion
The gold price enters the European session at a genuine decision point. The bounce from $4,235.17 is intact, but the Fed's hawkish hike has capped upside momentum and left price trapped below every major moving average that matters.
The bias is neutral-to-bearish while below $4,317.63. A clean hourly close under $4,300.80 opens $4,292.11 and then $4,277. A reclaim of R1 flips the near-term picture and puts $4,338.79 back in play.
Trade the level, not the narrative. The market will tell you which way it wants to go within the first London hour — respect the break, manage the risk, and let the ATR define your stops.
Frequently Asked Questions
- What is the gold price right now?
- The gold price is $4,304.53 as of the 06:00 UTC H1 close, up 1.04% from the daily open at $4,260.09 but down 0.79% for the week.
- Why did gold fall after the Fed rate hike?
- The Fed raised rates by a quarter point and Chair Warsh signalled further tightening. That pushed the 10-year Treasury yield back to 5% and lifted the dollar, raising the opportunity cost of holding bullion and driving the gold price to six-week lows near $4,235.17.
- What are the key support and resistance levels for gold today?
- Support sits at $4,300.80 (S1) and $4,292.11 (S2). Resistance is at $4,317.63 (R1) and $4,317.83 (R2). A break below S2 targets $4,277; a hold above R1 opens $4,338.79.
- Is gold still in a downtrend?
- Yes on the higher timeframes. Price at $4,304.53 is below the EMA200 at $4,351.24 and the D1 EMA200 at $4,319.11. The trend only flips bullish on a sustained daily close above $4,319.
- What is the expected trading range for gold this session?
- The ATR(14) of $23.42 suggests an hourly range of roughly 0.54% of price. For the European session, expect movement between $4,292 and $4,317 unless a catalyst triggers a breakout.
Trading Gold (XAU/USD) carries significant risk of loss and is not suitable for all investors. This content is for informational purposes only and does not constitute financial advice. Always conduct your own research and trade responsibly.