The gold price is trading at $4,058.70 in the Asian session, down 0.82% from the daily open of $4,088.73. This pullback follows Thursday's failed attempt to hold above $4,100, a level that has now capped two consecutive rallies. The move lower comes as traders position ahead of the US Non-Farm Payrolls report, due in roughly 11 hours, with forecasts calling for 65,000 job additions.
Yesterday's session saw gold surge to a two-week high near $4,097 before sellers stepped in. The rejection at that level, combined with a rising dollar and mixed macro signals, has left the metal in a consolidation pattern. This session is about preparation, not pursuit. Thin Asian liquidity means breakouts are unreliable, and the real test comes when New York opens.
Gold Market Overview
Macro Context
The broad dollar index sits at 121.7, up 0.3% week-over-week, and that strength is a clear headwind for the gold price. Real yields on 10-year TIPS have fallen to 2.64%, down 0.03% weekly, which should support bullion but has not yet translated into sustained buying. The 10-year nominal yield at 4.90% remains elevated, keeping the opportunity cost of holding gold high.
SPDR GLD holdings rose 2.8 tonnes to 1,040.5 tonnes, a modest inflow that signals institutional interest remains intact. CFTC data shows non-commercial speculators net long 186,451 contracts, confirming that the speculative community is still positioned for upside. News sentiment is mixed at +0.13, reflecting the tug-of-war between safe-haven demand and dollar strength.
Geopolitical risk has eased slightly after the Democratic sweep of the US midterms, which markets interpret as a check on fiscal expansion. Oil prices have fallen on hopes for Iran diplomacy, reducing inflation fears but also removing a key support for gold's inflation-hedge narrative.
Session Outlook
Asian session liquidity is thin, and the gold price is likely to oscillate between $4,056 and $4,071 until European desks arrive. The H1 chart shows a clear breakdown from the $4,092 open, with the price now testing the lower boundary of the recent range. Volume at 47,280 is above the 20-period average of 35,952, suggesting the move has some conviction, but Asian volume can be misleading.
Watch the $4,056 level closely. A break below it with rising volume would open the door to $4,028. Conversely, a reclaim of $4,071 would signal that the pullback is a buying opportunity.
Technical Analysis
Moving Average Structure
The H1 EMA20 sits at $4,096.77, well above the current gold price, confirming short-term bearish pressure. The EMA50 at $4,066.77 is also above the price, while the EMA200 at $4,027.13 remains below, preserving the broader bullish structure. This configuration, price below the fast EMAs but above the slow EMA, is typical of a pullback within an uptrend.
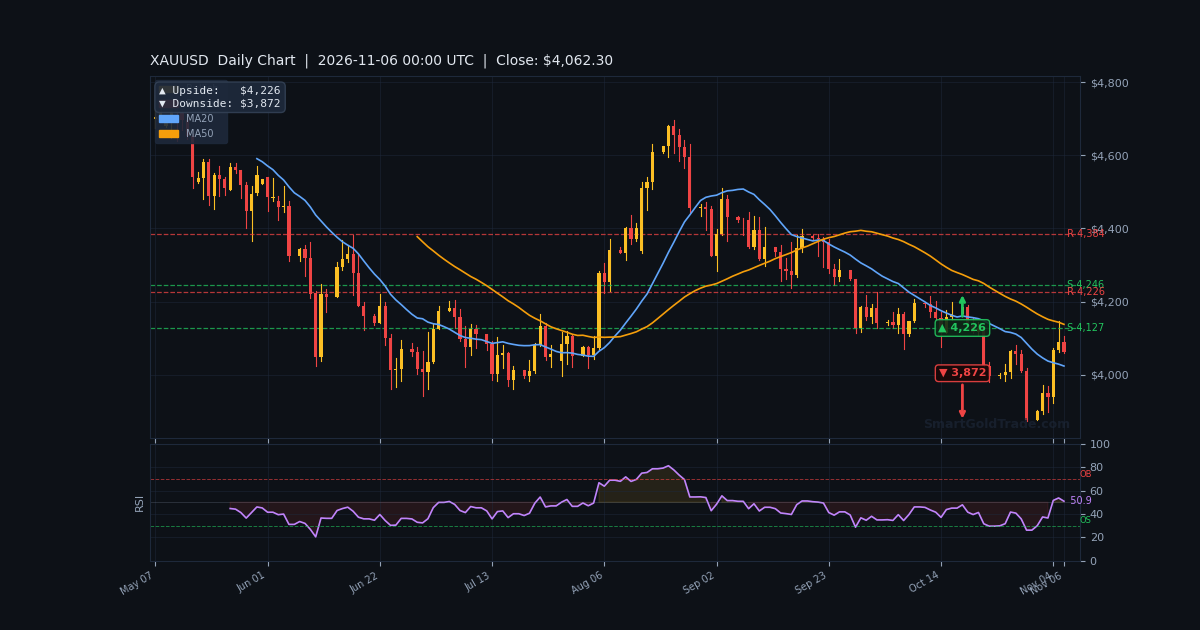
On the H4 timeframe, the close at $4,057.78 is above the EMA50 at $4,026.87 but below the EMA200 at $4,117.73. The daily close at $4,057.78 is below the D1 EMA50 at $4,153.85 and well below the D1 EMA200 at $4,259.88, highlighting that the higher timeframe remains in a corrective phase.
RSI and Momentum
The H1 RSI(14) at 40.2 is neutral, neither oversold nor overbought, giving room for further downside without triggering a reversal signal. The Stochastic at 18.7/23.1 is approaching oversold territory, which could attract dip buyers. The MACD histogram at -9.42 confirms bearish momentum, with the MACD line at 2.55 below the signal line at 11.97.
The ADX at 28.1 indicates a strong trend, but the -DI at 26.19 outweighs the +DI at 14.27, confirming that bears are in control of the current move. The ATR(14) at $23.51 suggests an expected hourly range of about 0.58% of price.
Key Price Levels
Immediate support rests at S1 $4,029.25 and S2 $4,028.13, a tight cluster that has held three times in the past 26 hours. Resistance is at R1 $4,070.86 and R2 $4,082.73. The VWAP at $4,082.51 aligns with R2, making that zone a key battleground.
The Fibonacci retracement from the recent swing shows the 61.8% level at $4,103.30, about 1.9 ATRs away. The upper trendline has a slope of 4.88/bar with a distance of 6.87 ATR, while the lower trendline has broken out, adding to the bearish short-term case.
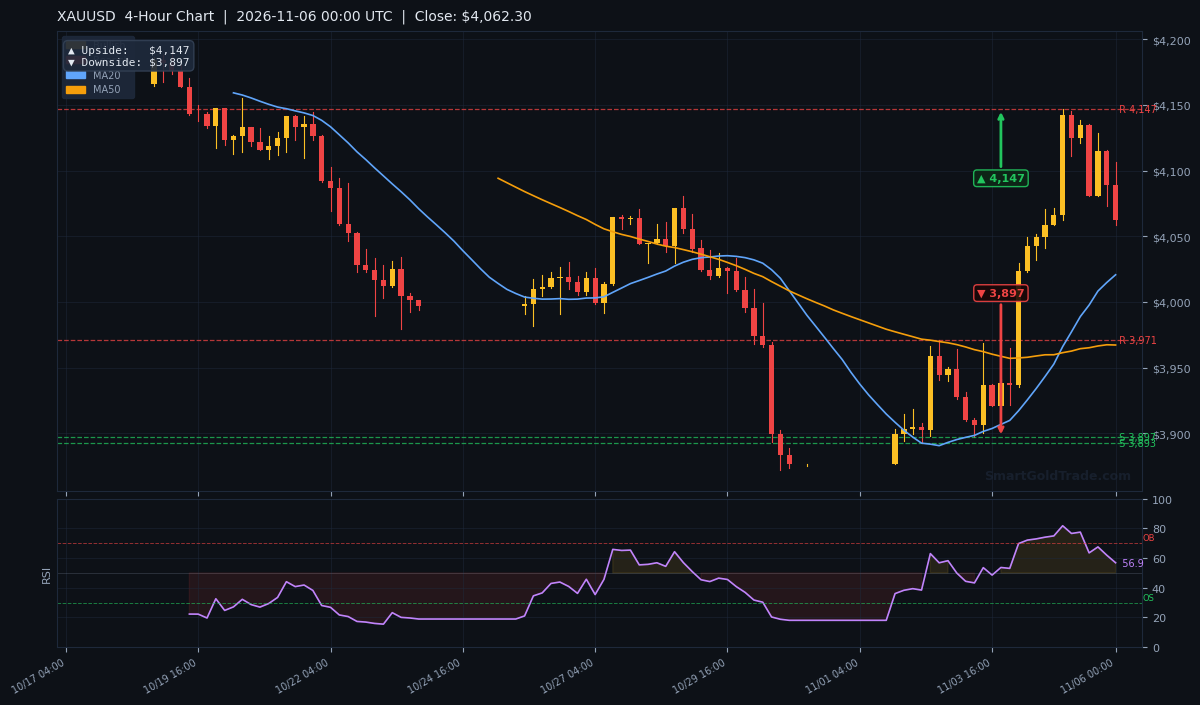
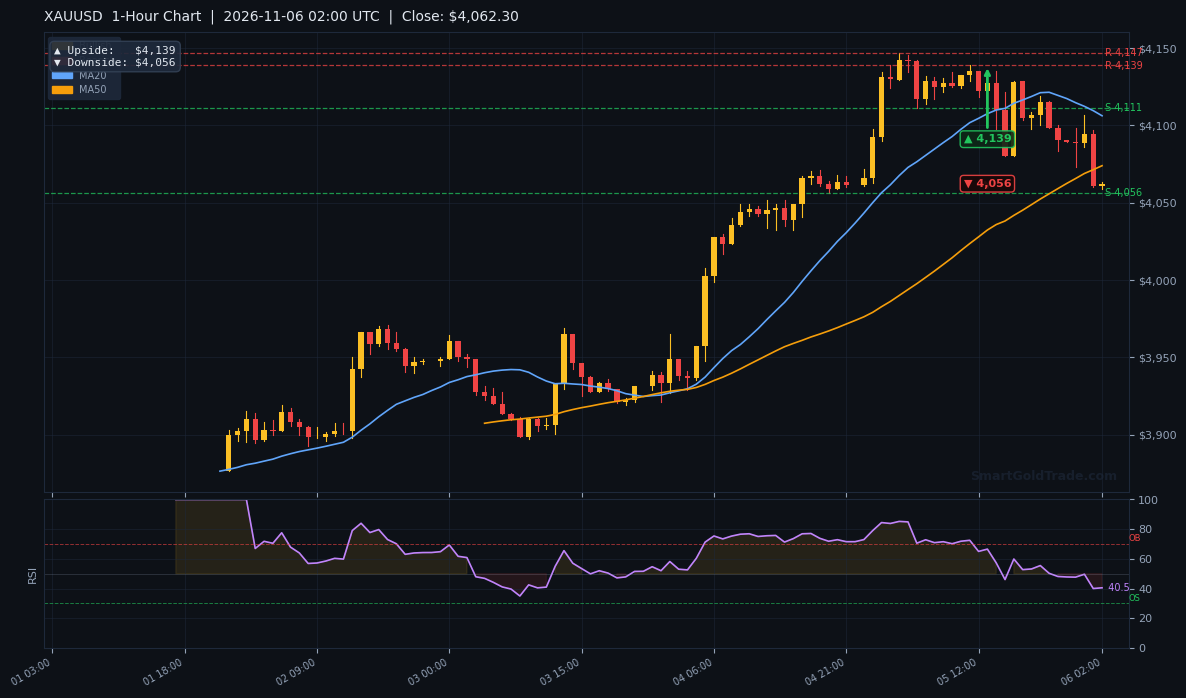
| Timeframe | Upside Target | Downside Target |
|---|---|---|
| Daily | $4,226 | $3,872 |
| 4-Hour | $4,147 | $3,897 |
| 1-Hour | $4,139 | $4,056 |
Fundamental Drivers
The dominant event is the US Non-Farm Payrolls report, due in about 11 hours. Forecasts call for 65,000 job additions, up from the previous 29,000, with the unemployment rate expected to hold at 4.2%. Average hourly earnings are forecast to rise 0.3% month-over-month, up from 0.1%. A strong print would reinforce the case for a December Fed hike, currently priced at nearly 71% probability, and could push the gold price toward $4,028.
Conversely, a weak report would validate the market's recent shift toward expecting a slower tightening path. The Democratic midterm sweep has already reduced fiscal expansion expectations, and softer jobs data would compound that narrative. In that scenario, gold could reclaim $4,082 and target $4,103.
The dollar's resilience despite falling real yields is the key puzzle. The broad dollar index at 121.7 is rising, which typically pressures gold. But GLD inflows and COT net longs suggest institutional investors are looking through the near-term dollar strength. The World Bank's projection that gold will hold above $4,000 through 2028 provides a longer-term anchor for bulls.
Key Event to Watch
The NFP report at 13:30 UTC is the single most important event this week. A print above 80,000 would likely trigger a dollar rally and test $4,028 support. A print below 50,000 would weaken the dollar and open the path to $4,103. Traders should avoid holding large positions into the release without a clear risk management plan. For those using automated systems, a news event trading protection tool can pause strategies during the release.
Unified Technical & Fundamental Outlook
The technical pillar is bullish with a score of +0.42, driven by the H1 trend and price above the EMA200. The fundamental pillar is also bullish at +0.18, supported by falling real yields, GLD inflows, and net-long COT positioning. The combined score of +0.30 with ALIGNED_BULLISH status suggests the broader bias remains to the upside.
However, the alignment is not without friction. The dollar is rising, which conflicts with the bullish fundamental score, and the H1 MACD histogram is negative. These are short-term headwinds within a larger bullish structure. The strongest confluence is the combination of falling real yields and institutional inflows, which historically precedes sustained gold rallies. The disagreement is the dollar's strength, which could delay the next leg higher.
Devil's Advocate
What could invalidate the bullish bias? A break below $4,028 on a daily closing basis would flip the structure bearish, targeting $3,872. The lower trendline has already broken out, and the -DI outweighs the +DI, suggesting bears have short-term control.
If the NFP print comes in above 100,000, the December hike probability could spike above 85%, triggering a dollar rally and a gold sell-off. The key reversal level is $4,028. A close below it would confirm the breakdown. Conversely, a reclaim of $4,082 would invalidate the bearish short-term case and shift the bias back to neutral.
Trading Strategy for Asian Session
Given thin liquidity, the strategy is to wait for clear levels rather than chase moves. For a long bias, consider an entry zone between $4,056 and $4,058, near the current price and the 1-hour downside target. Place a stop loss at $4,028, just below S1 and S2, risking about $28 or 1.2 ATR. Take profit targets are $4,082 (R2) and $4,103 (61.8% Fibonacci).
For a short bias, an entry near $4,071 (R1) with a stop at $4,083 (above R2) and a target of $4,029 (S1) offers a risk-reward of roughly 1:3.5. However, shorting into support with a bullish higher-timeframe structure is lower probability. The cleaner trade is to wait for a pullback to $4,056 and look for a reversal signal.
Position sizing should be conservative. The ATR of $23.51 means a 1% risk on a $10,000 account is $100, which equates to roughly 0.04 lots with a $28 stop. For those looking to trade gold without leverage, physical ownership by the gram removes the risk of liquidation but requires a longer time horizon.
Key Takeaways
- The gold price is at $4,058.70, down 0.82% today, with immediate support at $4,056.
- Resistance at $4,139 (1-hour upside target) caps the rebound; a break above would target $4,147.
- The H1 RSI at 40.2 is neutral, leaving room for further downside without a reversal signal.
- NFP in 11 hours is the key catalyst; a strong print could test $4,028, a weak print could target $4,103.
- GLD inflows of 2.8 tonnes and COT net longs of 186,451 contracts support the bullish medium-term bias.
- The dollar index at 121.7 is a headwind; a reversal lower would be the strongest bullish trigger.
Conclusion
The gold price is in a holding pattern, caught between a bullish higher-timeframe structure and short-term bearish momentum. The $4,056 support is the line in the sand. A hold above it keeps the bullish bias intact and sets up a potential run at $4,103 after the NFP. A break below it would shift focus to $4,028 and potentially $3,872.
For now, patience is the edge. The Asian session is for observation, not action. The real move comes when New York reacts to the jobs data. Keep position sizes small, respect the $4,028 stop level, and let the market show its hand before committing capital.
Frequently Asked Questions
- What is the gold price right now?
- The gold price is $4,058.70 per ounce in the Asian session, down 0.82% from the daily open of $4,088.73.
- What are the key support and resistance levels for gold?
- Immediate support is at $4,056, with stronger support at $4,028. Resistance is at $4,071 and $4,082, with the 1-hour upside target at $4,139.
- How will the NFP report affect the gold price?
- A strong NFP print above 80,000 could push gold toward $4,028 as rate hike bets rise. A weak print below 50,000 could lift gold to $4,103 as the dollar weakens.
- Is gold still in a bull market?
- Yes, on the higher timeframe. The price is above the H1 EMA200 at $4,027.13, and the combined technical and fundamental score is +0.30, aligned bullish. The short-term pullback is a correction within that trend.
- What is the expected trading range for today?
- The ATR of $23.51 suggests an hourly range of about 0.58%. For the session, expect a range between $4,028 and $4,082 unless the NFP triggers a breakout.
Trading Gold (XAU/USD) carries significant risk of loss and is not suitable for all investors. This content is for informational purposes only and does not constitute financial advice. Always conduct your own research and trade responsibly.